Fig. 4
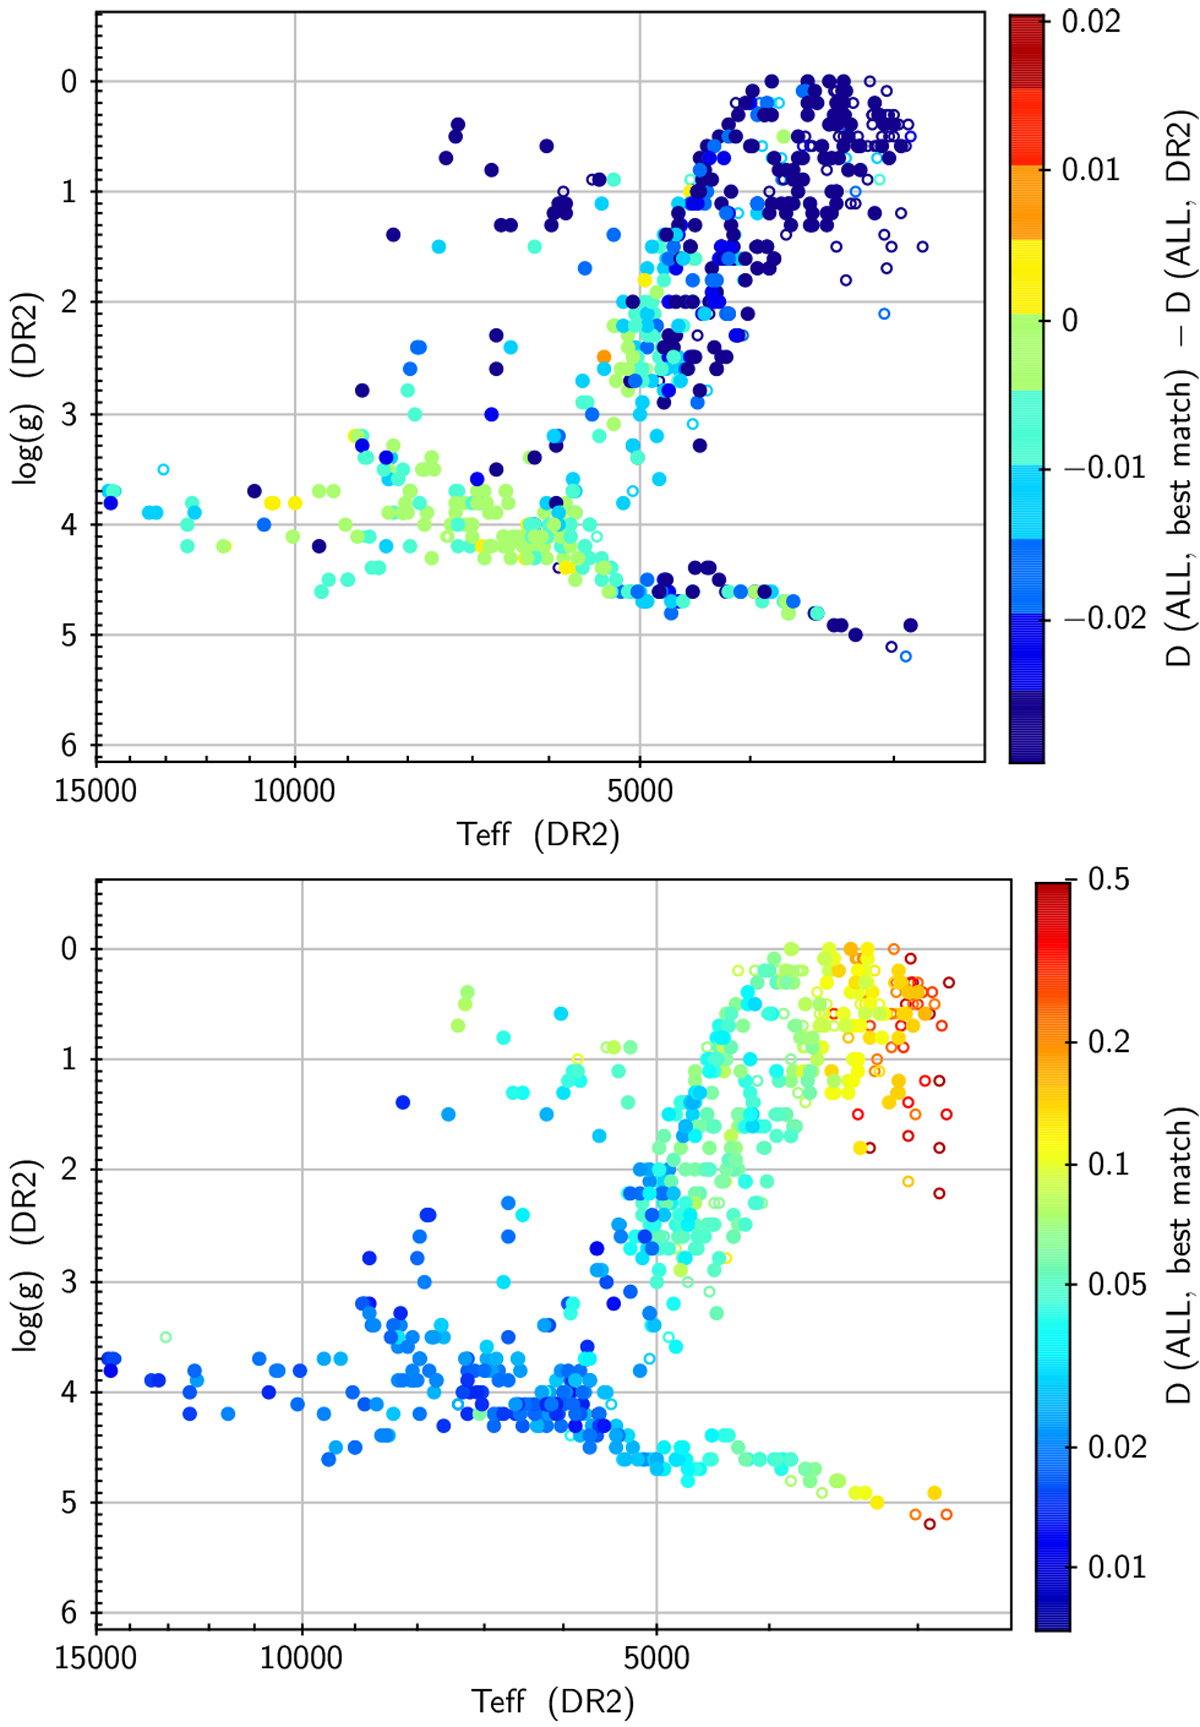
Top: change in the discrepancy measure D (Eq. (1)) when, instead of adopting stellar parameters from Arentsen et al. (2019), the parameters are freely optimized. The data points are located in the diagram according to the DR2-parameters of Arentsen et al. (2019) The symbol color maps the difference between the best-fit value of D (Eq. (1)) and its value for the DR2-parameters. Bottom: discrepancy D for the best-fit stellar parameters (to be compared to the bottom right panel of Fig. 2, where the parameters of Arentsen et al. (2019) were assumed). Complete versions of these figures, with one panel per arm, are available in Figs. D.1 and D.2.
Current usage metrics show cumulative count of Article Views (full-text article views including HTML views, PDF and ePub downloads, according to the available data) and Abstracts Views on Vision4Press platform.
Data correspond to usage on the plateform after 2015. The current usage metrics is available 48-96 hours after online publication and is updated daily on week days.
Initial download of the metrics may take a while.