Fig. B.1
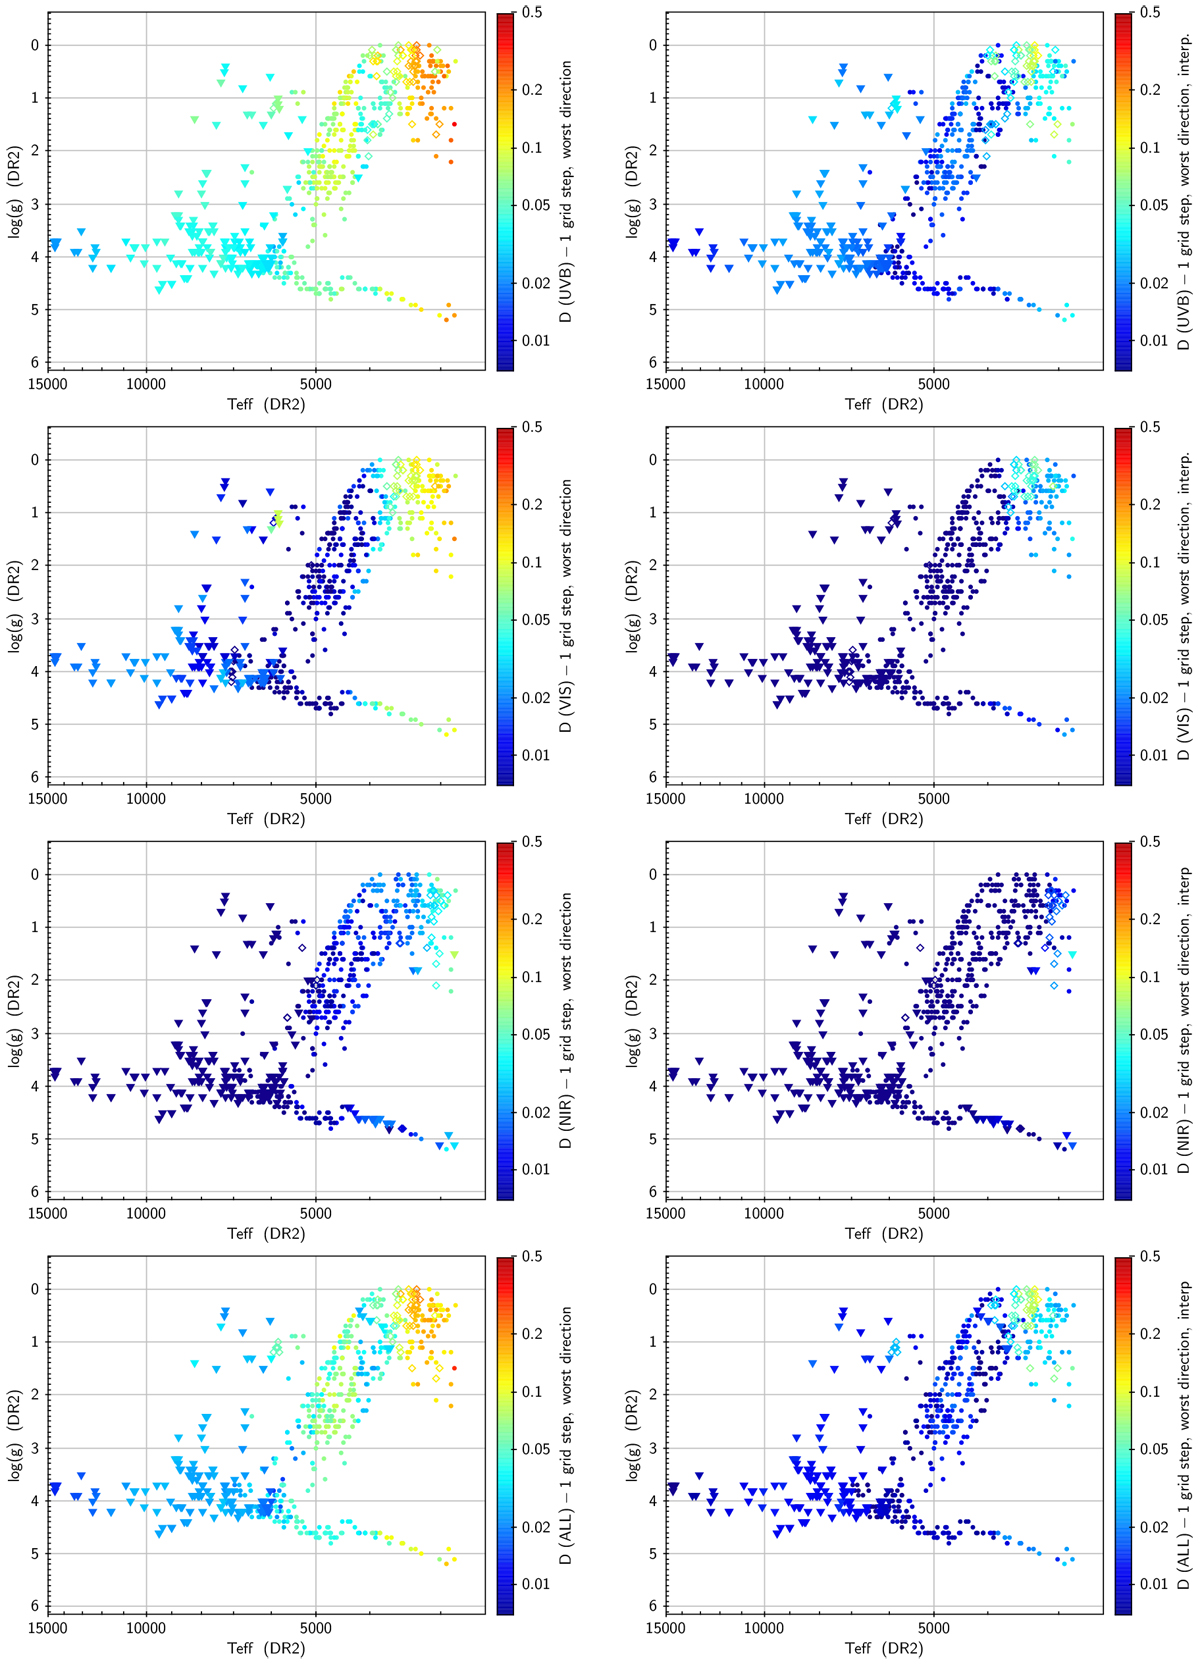
Sensitivity of D (Eq. (1)), measured at R = 500, to one step in Teff, log(g) or [Fe/H] in the worst direction in the grid of theoretical spectra. One symbol is plotted for each XSL spectrum. It is positioned according to the parameters of Arentsen et al. (2019) (as elsewhere in this article), and colored according to the largest 1-step difference D between the model closest to the XSL-spectrum’s parameters on one hand, and the six models surrounding that one on the other. In the left panels, the original grid of GSL models is used, while in the right panels interpolation was used to reduce the grid steps as detailed in Sect. 4.1. Triangles, small disks, or open diamonds indicate, respectively, that the largest D between neighboring models in the grid corresponds to a change in log(g), in [Fe/H] or in Teff. From top to bottom, the wavelength ranges used are the UVB, the VIS, and the NIR arms, and finally all X-shooter wavelengths (ALL).
Current usage metrics show cumulative count of Article Views (full-text article views including HTML views, PDF and ePub downloads, according to the available data) and Abstracts Views on Vision4Press platform.
Data correspond to usage on the plateform after 2015. The current usage metrics is available 48-96 hours after online publication and is updated daily on week days.
Initial download of the metrics may take a while.