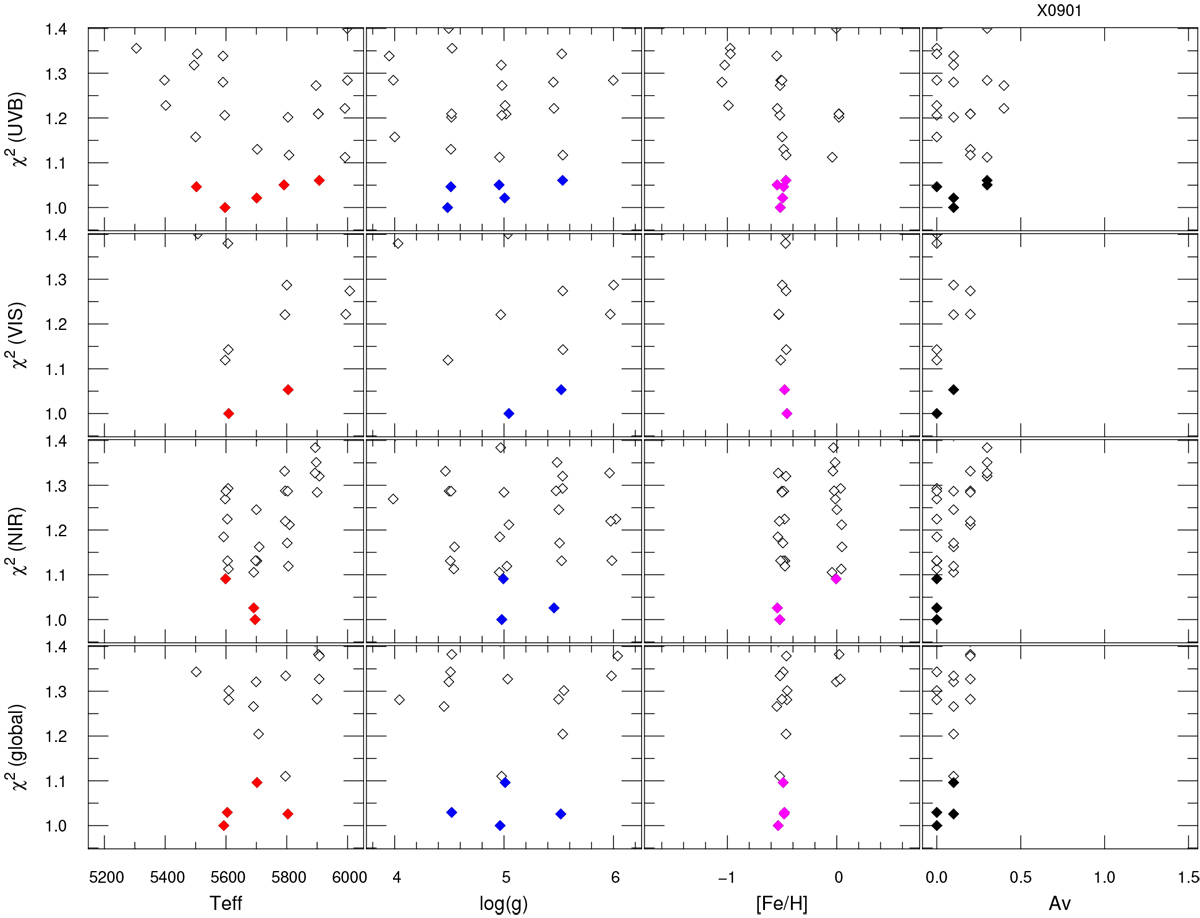
Fig. A.4

χ2 distributions around the minimum, as a function of the wavelength range used to constrain the fits and as a function of the four model parameters (here, [α/Fe] = 0 is assumed). The χ2 values are rescaled to a minimum of 1 for display; only values smaller than 1.4 are shown. For this star, the parameter estimates based on each arm separately or on all arms jointly are consistent with each other. The bottom left panel illustrates effects of the discrete sampling of the model grid: at 5700 K, the available values of the other parameters lead to a higher global χ2 than at 5600 or 5800 K. To produce Figs. A.1, A.2, and A.3 we have interpolatedin the original model grid around the minima of the present figure – hence the slightly different parameters in those figures.
Current usage metrics show cumulative count of Article Views (full-text article views including HTML views, PDF and ePub downloads, according to the available data) and Abstracts Views on Vision4Press platform.
Data correspond to usage on the plateform after 2015. The current usage metrics is available 48-96 hours after online publication and is updated daily on week days.
Initial download of the metrics may take a while.


