Fig. A.3
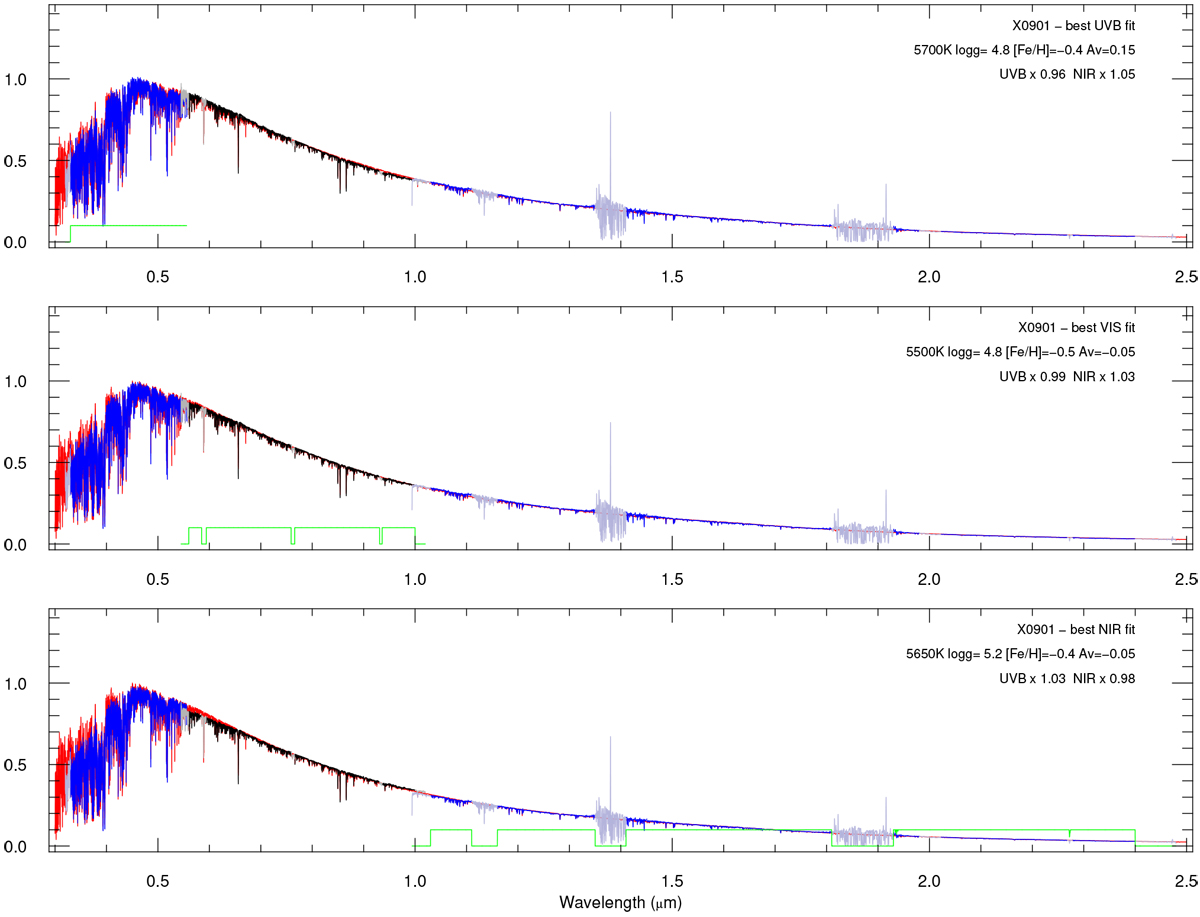
Best fits to the XSL spectrum of HD 111515 (observation X0901), but this time using only one of the three XSL arms in the optimization process: the UVB arm in the top panel, the VIS arm in the middle, and the NIR arm in the lower panel.The best-fit synthetic spectrum is shown in red, the empirical spectra in blue and black, or in gray for the masked regions (the mask, rescaled for display purposes, is displayed in green). In each panel, the arm-spectra not used in the fit are simply overlaid, after independent rescaling to the level of the synthetic spectrum. The scaling factors in the legends are those applied to the UVB and NIR observations relative to the VIS observations. The parameters vary between the panels.
Current usage metrics show cumulative count of Article Views (full-text article views including HTML views, PDF and ePub downloads, according to the available data) and Abstracts Views on Vision4Press platform.
Data correspond to usage on the plateform after 2015. The current usage metrics is available 48-96 hours after online publication and is updated daily on week days.
Initial download of the metrics may take a while.