Fig. A.1
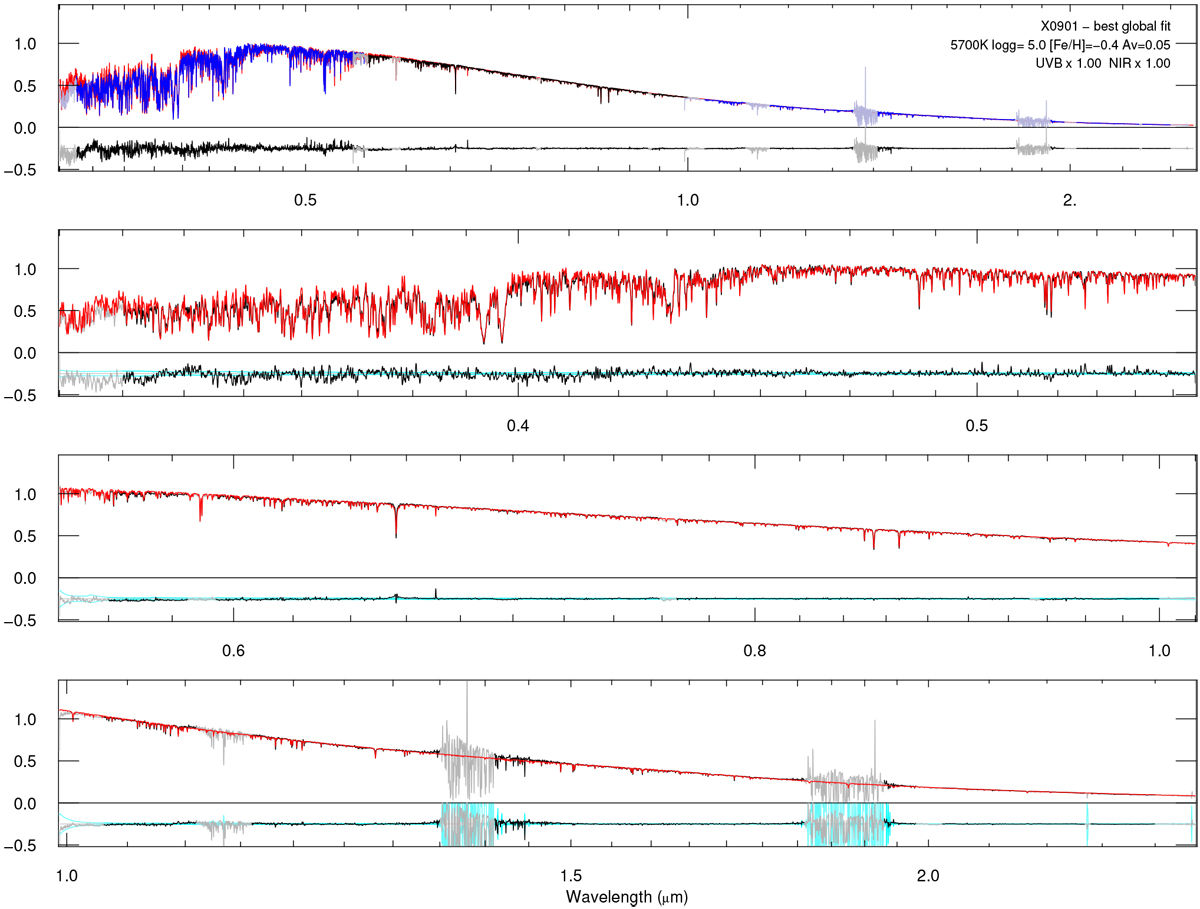
Best fit to the XSL spectrum of HD 111515 (observation X0901), at R = 3000, using all (but masked) wavelengths. Each XSL-arm is rescaled independently to optimize the global quality of the fit. The model is shown in red. In the top panel, the blue-black-blue color-scheme identifies the three arms of X-shooter spectra, which are then shown separately (in black) in the three lower panels. Masked wavelength regions in the XSL data are plotted in gray. The noise spectra from the XSL pipeline are in cyan.
Current usage metrics show cumulative count of Article Views (full-text article views including HTML views, PDF and ePub downloads, according to the available data) and Abstracts Views on Vision4Press platform.
Data correspond to usage on the plateform after 2015. The current usage metrics is available 48-96 hours after online publication and is updated daily on week days.
Initial download of the metrics may take a while.