Fig. 8.
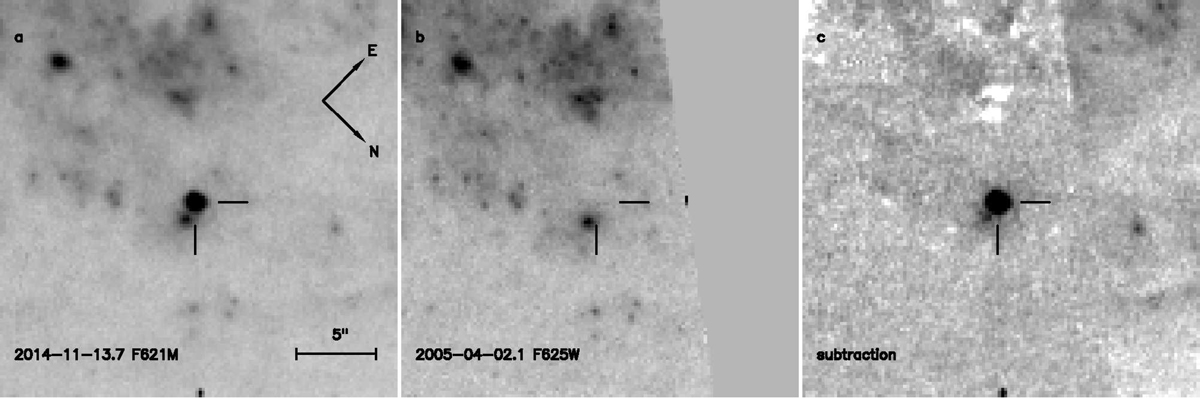
Subsection images of the field of PSN102750. a) Late-time HST F621M image of PSN102750 observed 190 d after the discovery of the transient, b) Pre-explosion HST F625W image of the field of the transient, and c) Subtraction between the images. In addition to the event, the subtraction also results in some faint residuals from sources in the field, likely due to the somewhat different filter widths of the two epochs of observations. The transient locations are shown with tick marks. The orientation and image scale are indicated in the left panel.
Current usage metrics show cumulative count of Article Views (full-text article views including HTML views, PDF and ePub downloads, according to the available data) and Abstracts Views on Vision4Press platform.
Data correspond to usage on the plateform after 2015. The current usage metrics is available 48-96 hours after online publication and is updated daily on week days.
Initial download of the metrics may take a while.