Fig. 5.
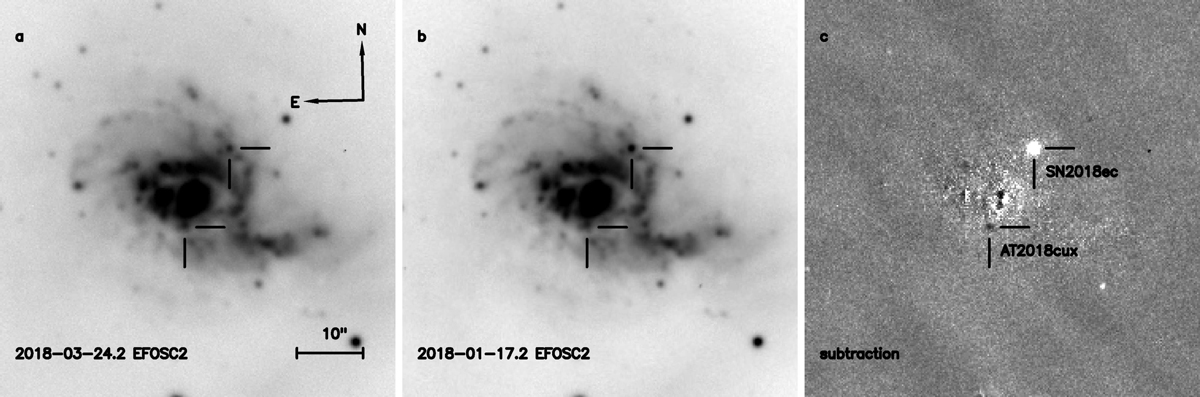
Subsection images (1′ × 1′) of the field of AT 2018cux in NGC 3256. a) EFOSC2 i-band discovery image (![]() ) of AT 2018cux, b) EFOSC2 pre-discovery image (
) of AT 2018cux, b) EFOSC2 pre-discovery image (![]() ), and c) Subtraction between the images. The locations of SN 2018ec and AT 2018cux are shown with tick marks in all the panels. Since the reference image contains increased flux from SN 2018ec compared to that of the AT 2018cux discovery image, the colour scale of the two events is reversed in the subtraction. The image scale and orientation are indicated in the left panel.
), and c) Subtraction between the images. The locations of SN 2018ec and AT 2018cux are shown with tick marks in all the panels. Since the reference image contains increased flux from SN 2018ec compared to that of the AT 2018cux discovery image, the colour scale of the two events is reversed in the subtraction. The image scale and orientation are indicated in the left panel.
Current usage metrics show cumulative count of Article Views (full-text article views including HTML views, PDF and ePub downloads, according to the available data) and Abstracts Views on Vision4Press platform.
Data correspond to usage on the plateform after 2015. The current usage metrics is available 48-96 hours after online publication and is updated daily on week days.
Initial download of the metrics may take a while.