Fig. 3.
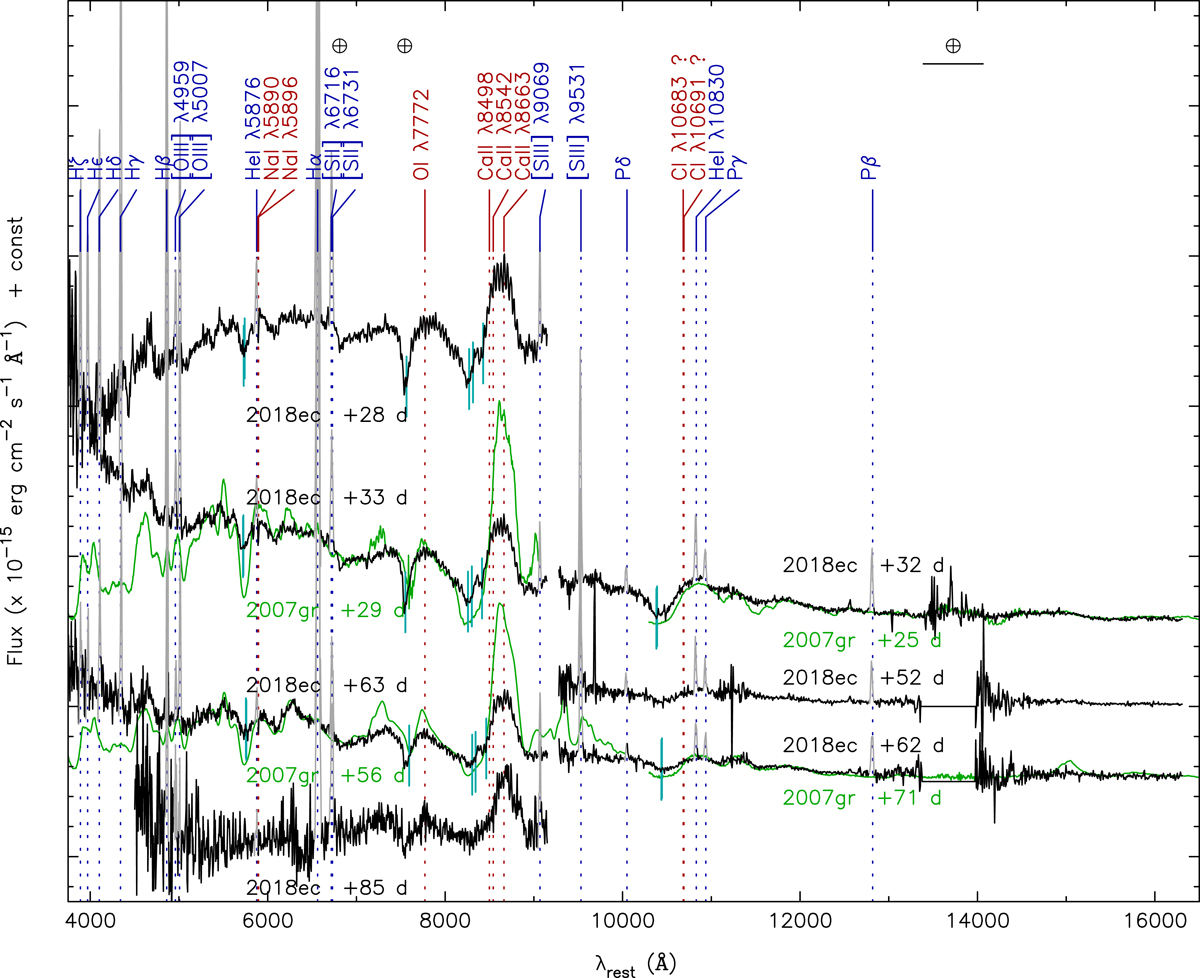
Spectral time series of SN 2018ec. The spectra have been redshift corrected to rest frame. The spectra have been corrected for both Galactic AV = 0.334 mag and estimated host galaxy extinction of AV = 2.1 mag. The epochs are provided respective to the estimated light curve maximum. The main narrow-line emission features arising from an incomplete host galaxy subtraction are in grey. The most prominent identified spectral features are labelled coming either from the SN (red) or from the host galaxy (blue). The Doppler shifted position of the SN lines are indicated with cyan vertical lines in selected epochs as suggested by the velocity of the Na I absorption minimum. The main telluric bands are indicated with a circled plus sign (⊕). For comparison selected spectra of normal Type Ic SN 2007gr are overlaid (green). The continua of the optical spectra of SN 2018ec are likely contaminated by the complex host background that was not successfully completely subtracted. Therefore, the optical SN features of SN 2018ec above and below the continuum level appear less prominent than those of SN 2007gr. The spectra have been shifted vertically for clarity.
Current usage metrics show cumulative count of Article Views (full-text article views including HTML views, PDF and ePub downloads, according to the available data) and Abstracts Views on Vision4Press platform.
Data correspond to usage on the plateform after 2015. The current usage metrics is available 48-96 hours after online publication and is updated daily on week days.
Initial download of the metrics may take a while.