Fig. 16.
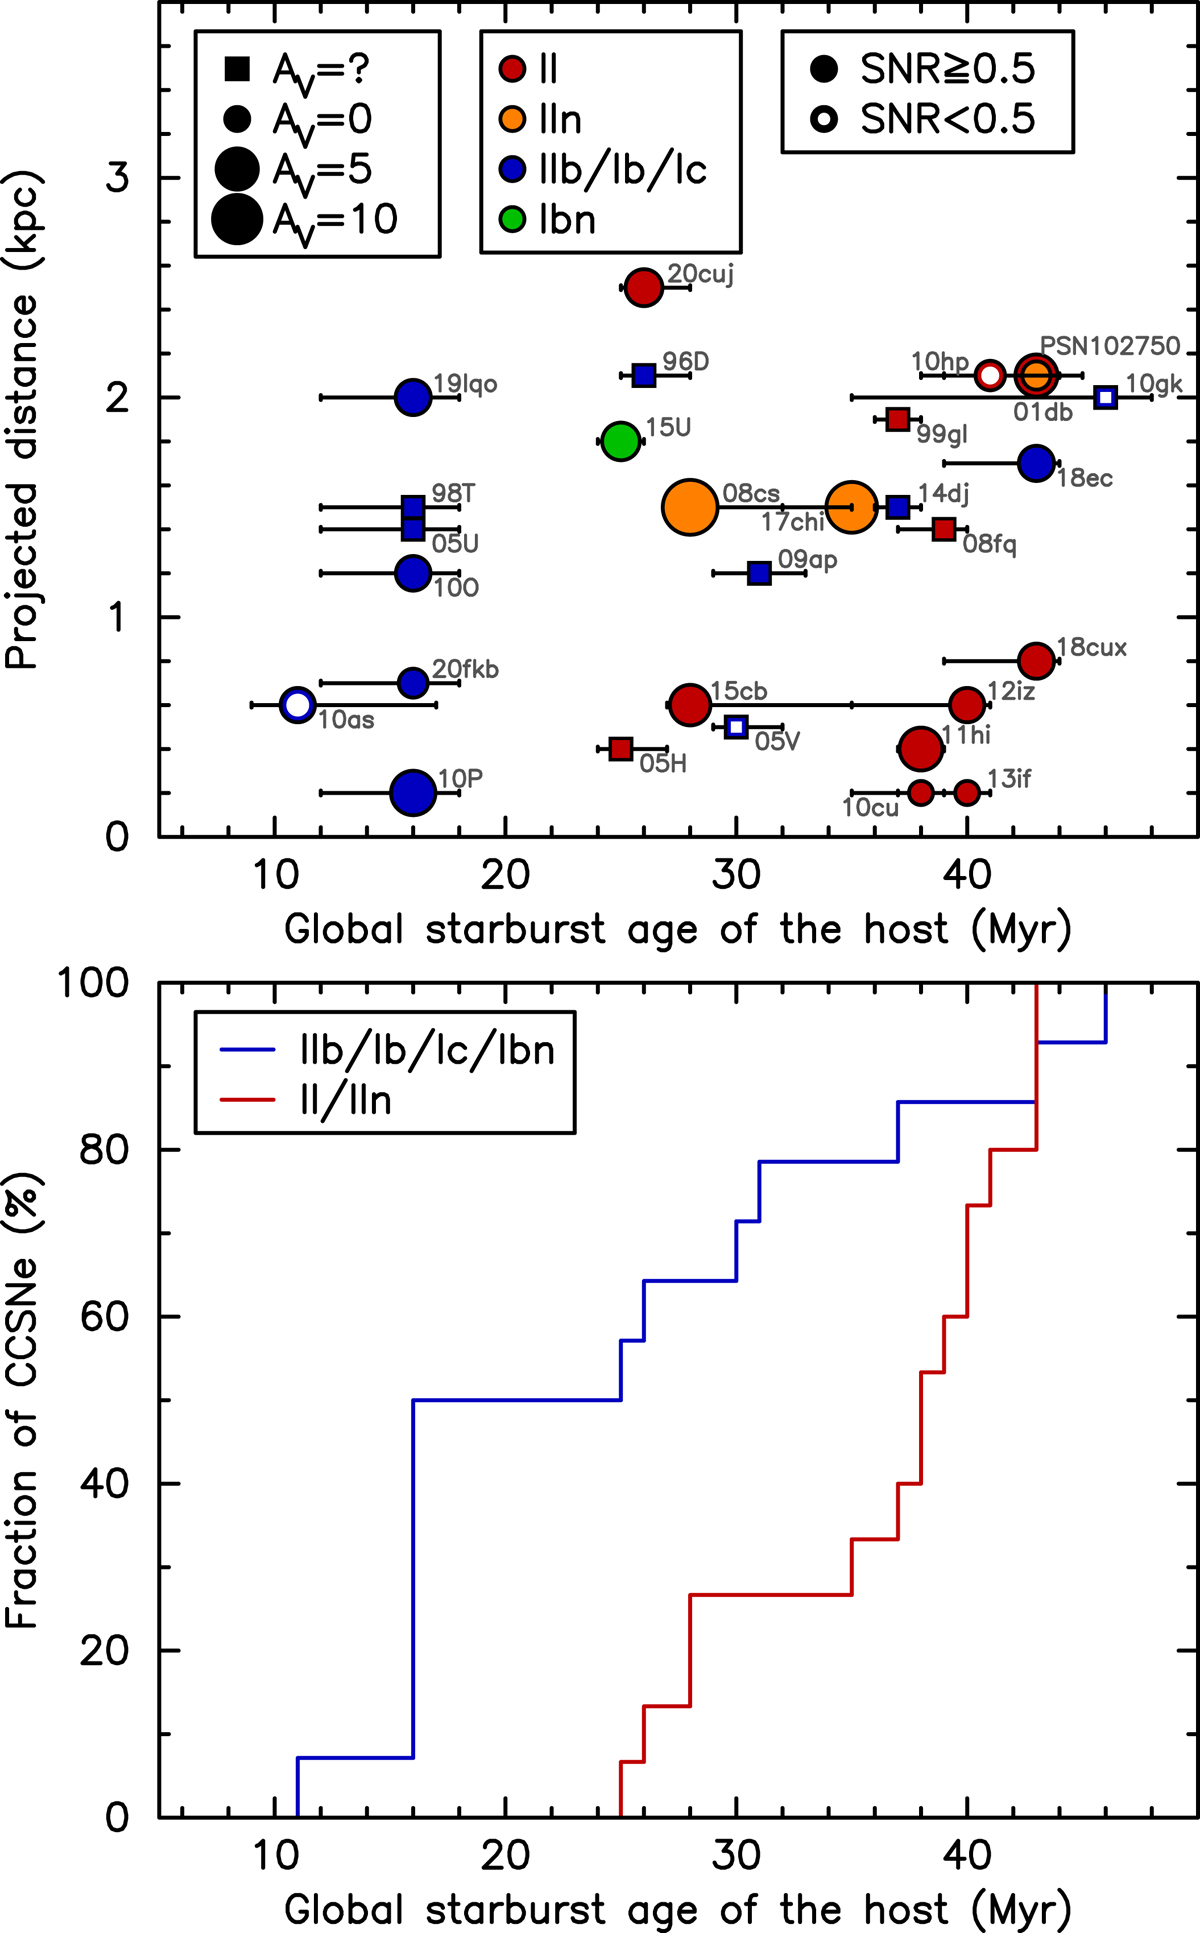
Comparison between the starburst age and the CCSN subtype. Upper panel: type distribution of classified CCSNe compared to our SED modelled global age of the host starburst at the central regions of our sample LIRGs. Host galaxy extinctions of the SNe are indicated by the sizes of the circles; unknown (and likely small) extinction cases are indicated by squares. The symbol colours indicate the CCSN subtype classifications. The events are indicated with closed and open symbols based on their estimated host CCSN rate above and below 0.5 CCSN yr−1, respectively. Lower panel: simplified cumulative distribution presentation of the upper panel data of the Type IIb/Ib/Ic/Ibn and Type II/IIn samples of CCSNe. The data suggests that H-poor and H-rich CCSNe come from very young (≲30 Myr) and older (≳30 Myr) starbursts, respectively.
Current usage metrics show cumulative count of Article Views (full-text article views including HTML views, PDF and ePub downloads, according to the available data) and Abstracts Views on Vision4Press platform.
Data correspond to usage on the plateform after 2015. The current usage metrics is available 48-96 hours after online publication and is updated daily on week days.
Initial download of the metrics may take a while.