Fig. 10.
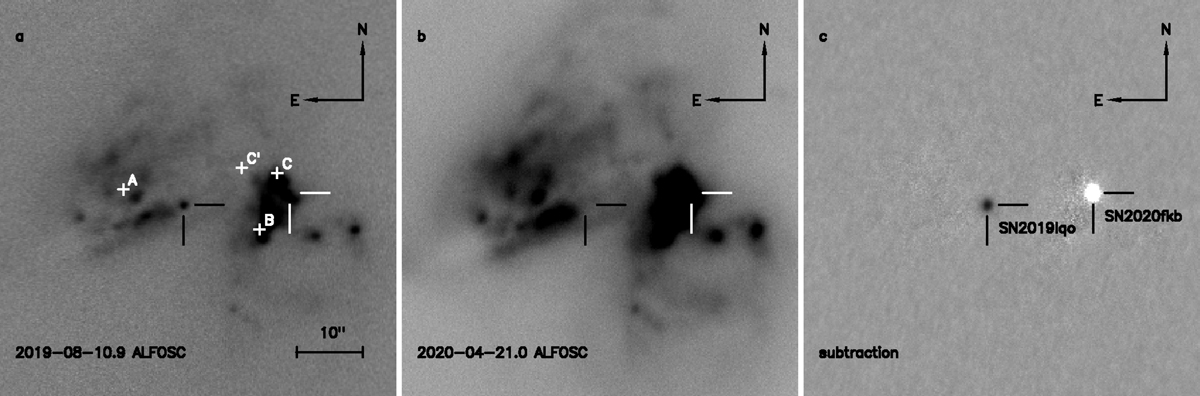
Subsection images (1′ × 1′) of the field of Arp 299. a) NOT V-band follow-up image of SN 2019lqo, b) NOT follow-up image of SN 2020fkb, and c) Subtraction between the images. The tick marks indicate the locations of SNe 2019lqo and 2020fkb. The image scale and orientation are indicated in the left panel. The locations of IR bright main components (A, B, C, C′) of Arp 299 (Gehrz et al. 1983) illustrate that some of these regions are obscured in optical wavelengths.
Current usage metrics show cumulative count of Article Views (full-text article views including HTML views, PDF and ePub downloads, according to the available data) and Abstracts Views on Vision4Press platform.
Data correspond to usage on the plateform after 2015. The current usage metrics is available 48-96 hours after online publication and is updated daily on week days.
Initial download of the metrics may take a while.