Fig. 2.
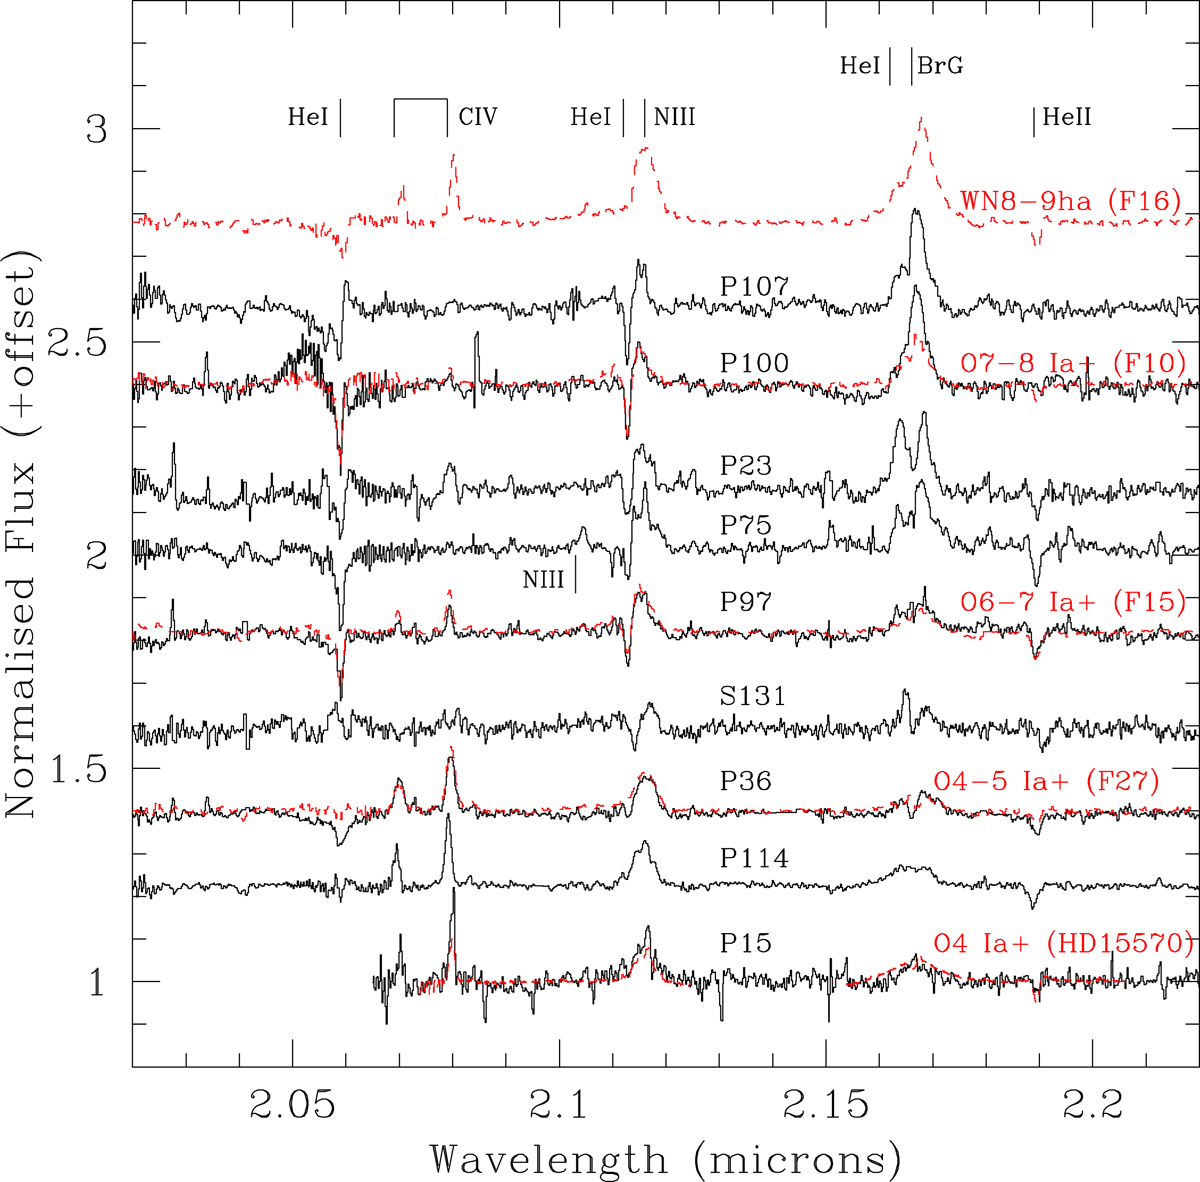
Montage of spectra of isolated O hypergiants. Template spectra are overplotted in red along with identifications; we also show the spectrum of F16, the WN8-9ha star with the weakest emission lines within the Arches (Clark et al. 2018a), for comparison to P100 and 107. We note that a narrow emission feature of uncertain origin at line centre of Brγ in the spectrum of P114 was removed, leaving an artificially flat topped profile.
Current usage metrics show cumulative count of Article Views (full-text article views including HTML views, PDF and ePub downloads, according to the available data) and Abstracts Views on Vision4Press platform.
Data correspond to usage on the plateform after 2015. The current usage metrics is available 48-96 hours after online publication and is updated daily on week days.
Initial download of the metrics may take a while.