Fig. 8
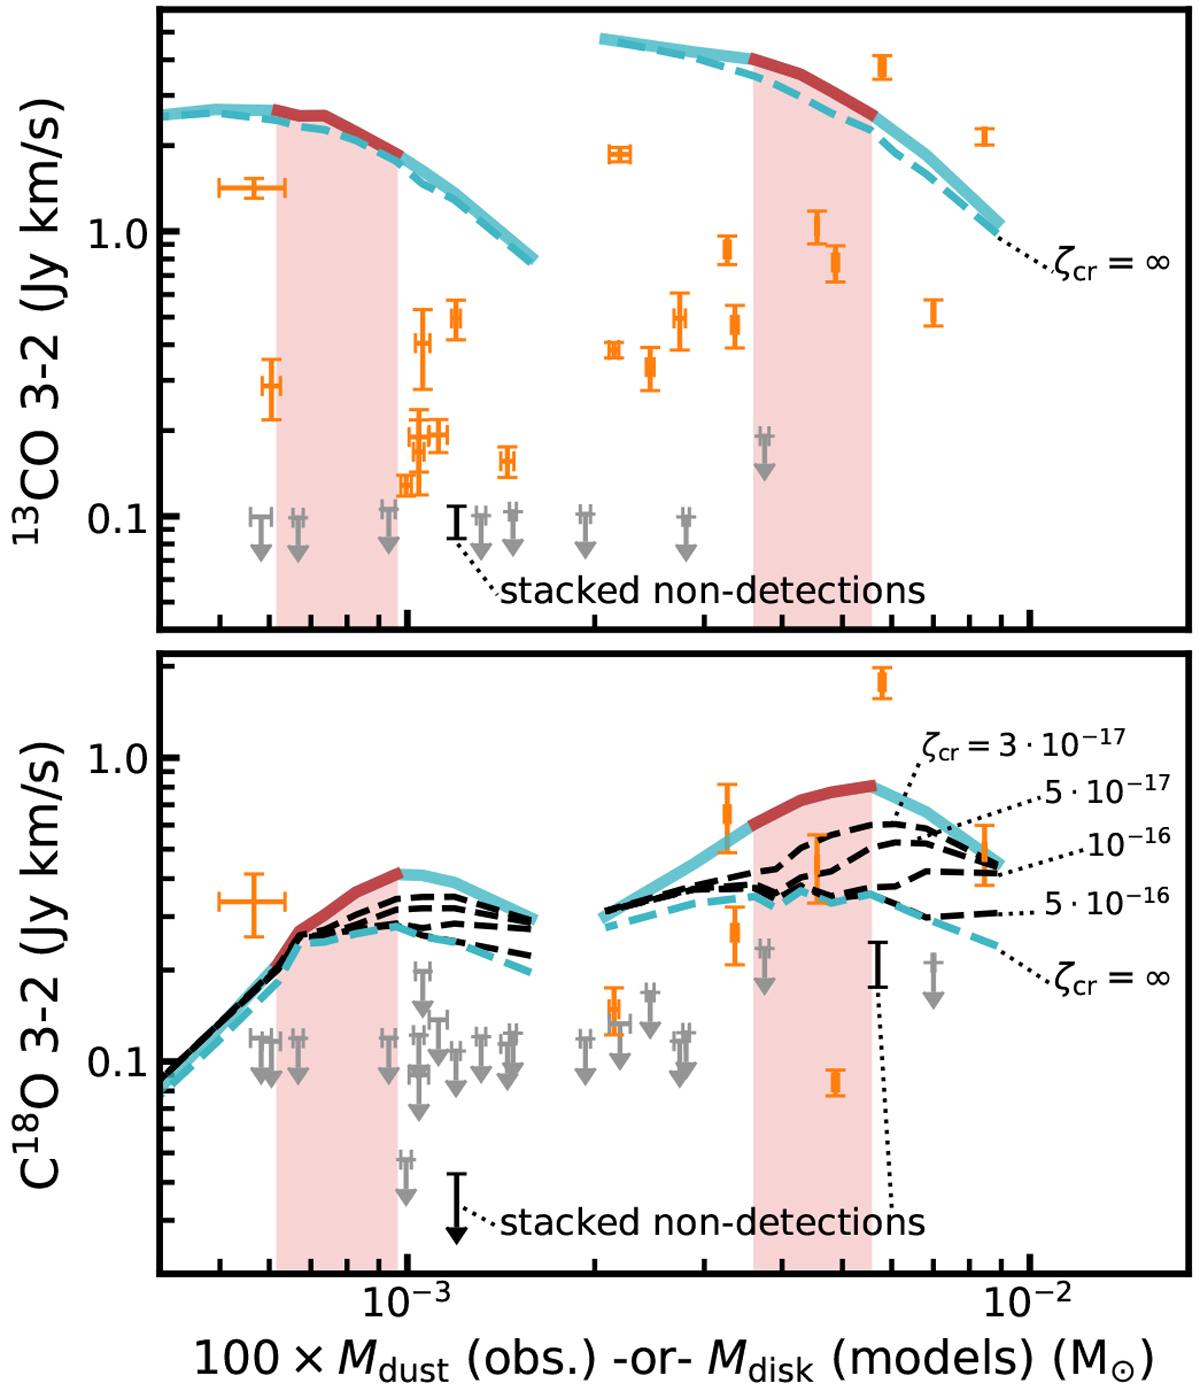
Effect of the cosmic ray ionization rate on 13CO and C18O J = 3− 2 line fluxes, shown in the top and bottom panel respectively. Models shown here have αvisc = 10−3 and M* = [ 0.2, 0.32 ] M⊙. Solid light blue lines show the model line fluxes where CO conversion through grain-surface chemistry is calculated with a cosmic ray ionization rate ζcr = 1 × 10⁻¹⁷ s−1. For the black dashed lines ζcr is increased up to 5 × 10⁻¹⁶ s−1. The dashed blue line shows the upper limit of the effect of grain-surface chemistry, where we have removed all CO in the region of the disk where CO conversion by grain-surface chemistry is effective. Observations in Lupus are shown in orange if detected and in gray if an upper limit (Ansdell et al. 2016; Yen et al. 2018). The stacked non-detections are shown in black (see also Sect. 3.3). The red shaded lane highlights the age range of the Lupus star-formingregion.
Current usage metrics show cumulative count of Article Views (full-text article views including HTML views, PDF and ePub downloads, according to the available data) and Abstracts Views on Vision4Press platform.
Data correspond to usage on the plateform after 2015. The current usage metrics is available 48-96 hours after online publication and is updated daily on week days.
Initial download of the metrics may take a while.