Fig. 3
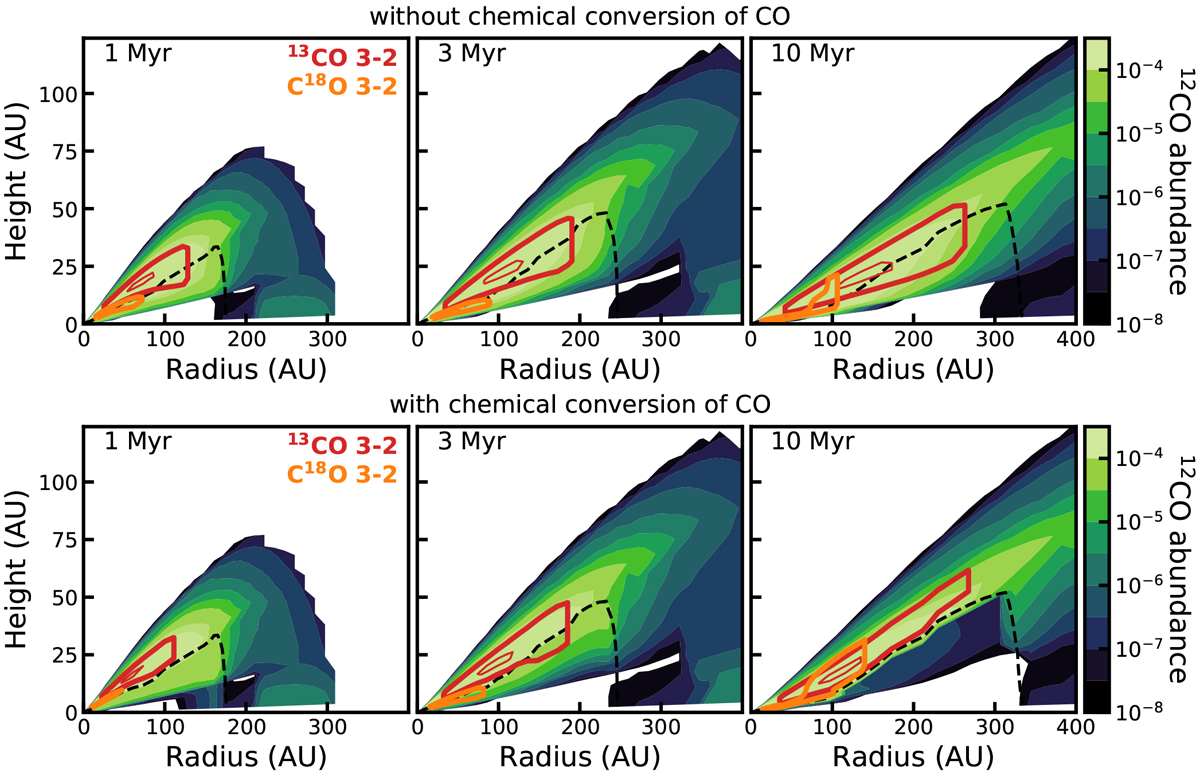
Effect of the chemical conversion of CO on the CO abundance after 1, 3 and 10 Myr. The example model shown here has M* = 0.32 M⊙ and αvisc = 10−3. Top panels: CO abundances have been calculated using the DALI chemical network (see Sect. 2.3.1).Bottom panels: we have included the chemical conversion of CO into other species, as described in Sect. 2.3.2. Colors show the CO abundance with respect to H2, where white indicates CO/H2 ≤ 10−8. The dashed black line shows where ≤5% of the total amount of oxygen is in O(g)+OH(g), the gas temperature Tgas ≤ 35 K and outwardCO column is ≥1016 cm−2. Grain-surface chemistry is calculated below this black dashed line. Red contours show the 13 CO J = 3− 2 emitting region, enclosing 25 and 75% of the total 13CO flux. Similarly, the orange contours show the C18O J = 3− 2 emitting region.
Current usage metrics show cumulative count of Article Views (full-text article views including HTML views, PDF and ePub downloads, according to the available data) and Abstracts Views on Vision4Press platform.
Data correspond to usage on the plateform after 2015. The current usage metrics is available 48-96 hours after online publication and is updated daily on week days.
Initial download of the metrics may take a while.