Fig. D.1
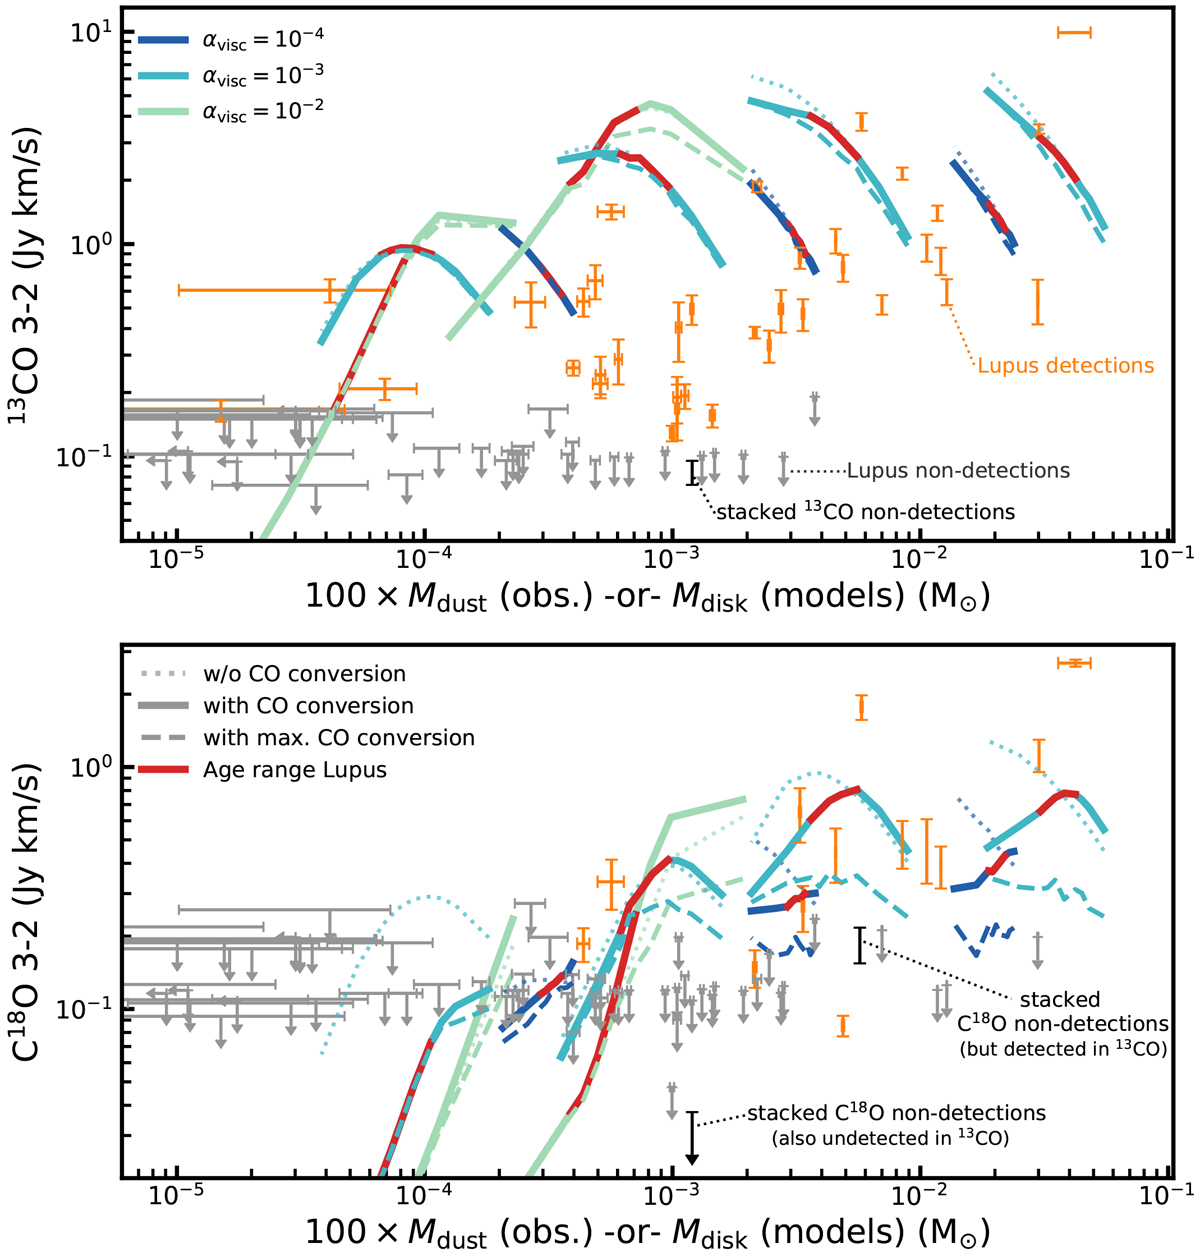
As Fig. 6, but now showing three sets of models. The dotted lines show the 13 CO (top) and C18O (bottom) J = 3−2 line fluxes for models with standard DALI chemistry, that is, without CO conversion. The solid lines show line fluxes for the models where CO has been chemically converted into other species, as described in Sect. 2.3.2. The dashed lines show line fluxes for models with maximal CO conversion, where we have removed all CO in the region where CO conversion through grain-surface chemistry occurs (see also Sect. 8). Observations in Lupus are shown in orange if detected and gray if an upper limit (Ansdell et al. 2016; Yen et al. 2018). Stacked non-detections are shown in black (see Sect. 3.3).
Current usage metrics show cumulative count of Article Views (full-text article views including HTML views, PDF and ePub downloads, according to the available data) and Abstracts Views on Vision4Press platform.
Data correspond to usage on the plateform after 2015. The current usage metrics is available 48-96 hours after online publication and is updated daily on week days.
Initial download of the metrics may take a while.