Fig. B.1
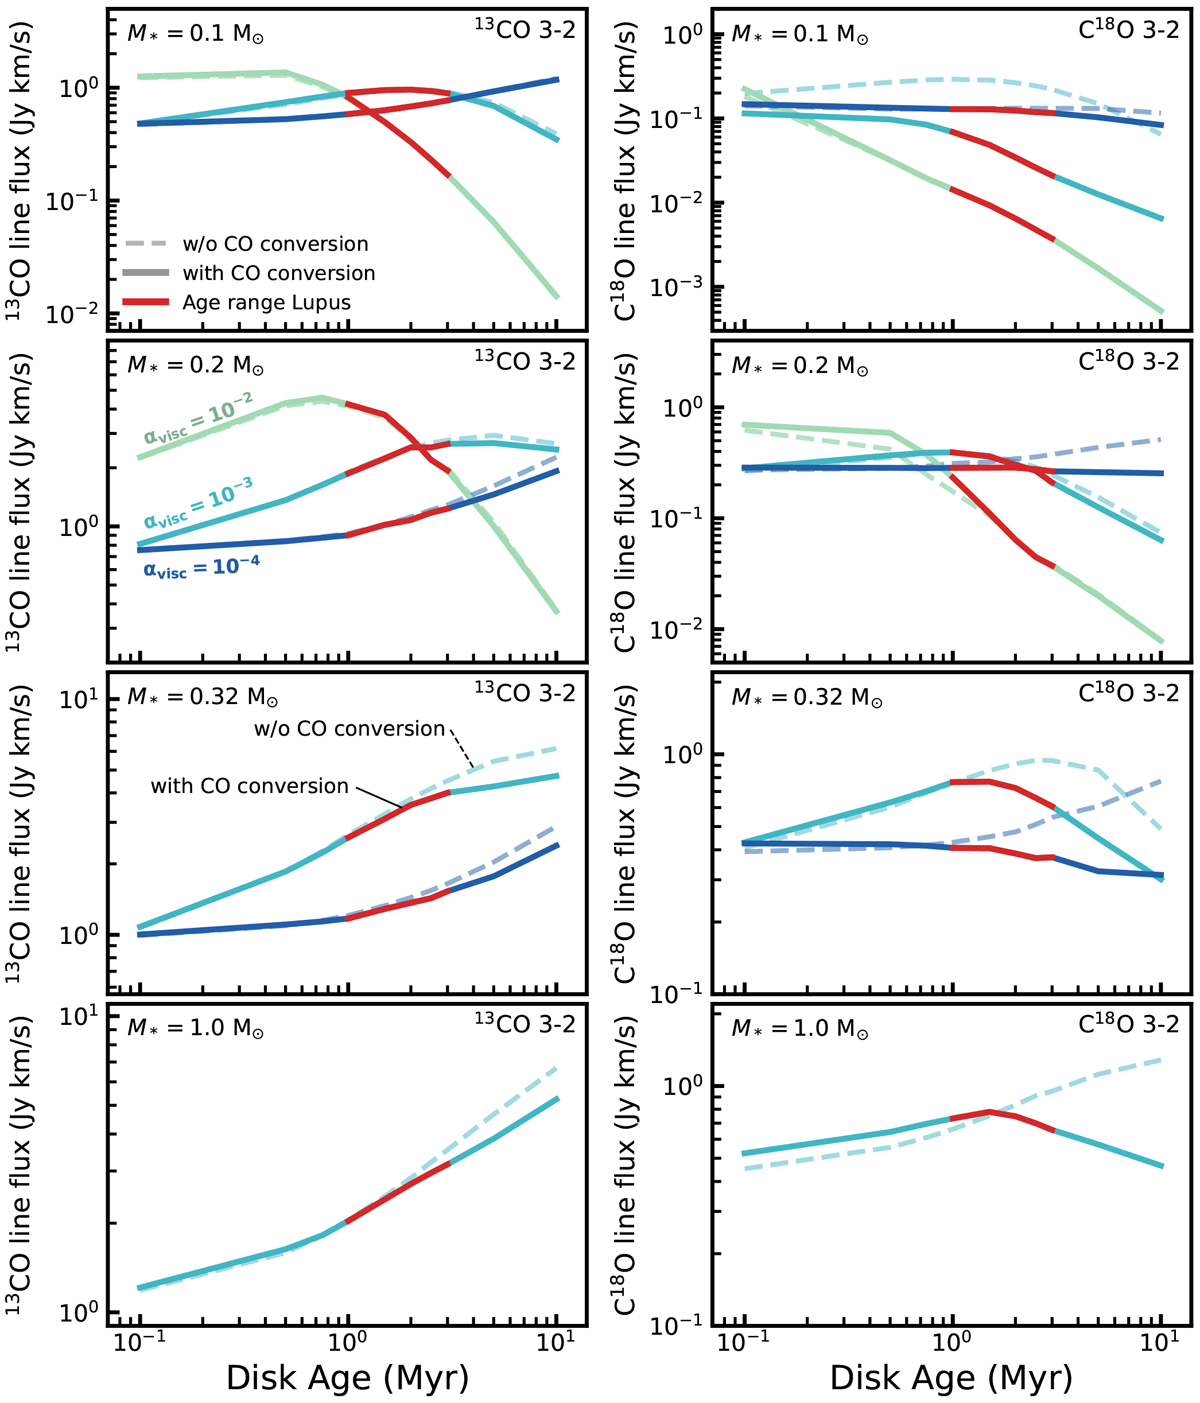
As Fig. 6, but showing the 13CO (left) and C18O (right) J = 3− 2 fluxes for all models. Colors indicate different αvisc. Models with and without CO conversion through grain-surface chemistry are shown with solid and dashed lines, respectively. The age range for disks in Lupus is highlighted in red. Few models show a significant decrease in 13CO line fluxes, except for models with αvisc = 10−2 that have low disk masses. The C18O line fluxes do show a decrease with age, especially at later disk ages.
Current usage metrics show cumulative count of Article Views (full-text article views including HTML views, PDF and ePub downloads, according to the available data) and Abstracts Views on Vision4Press platform.
Data correspond to usage on the plateform after 2015. The current usage metrics is available 48-96 hours after online publication and is updated daily on week days.
Initial download of the metrics may take a while.