Free Access
Fig. A.1
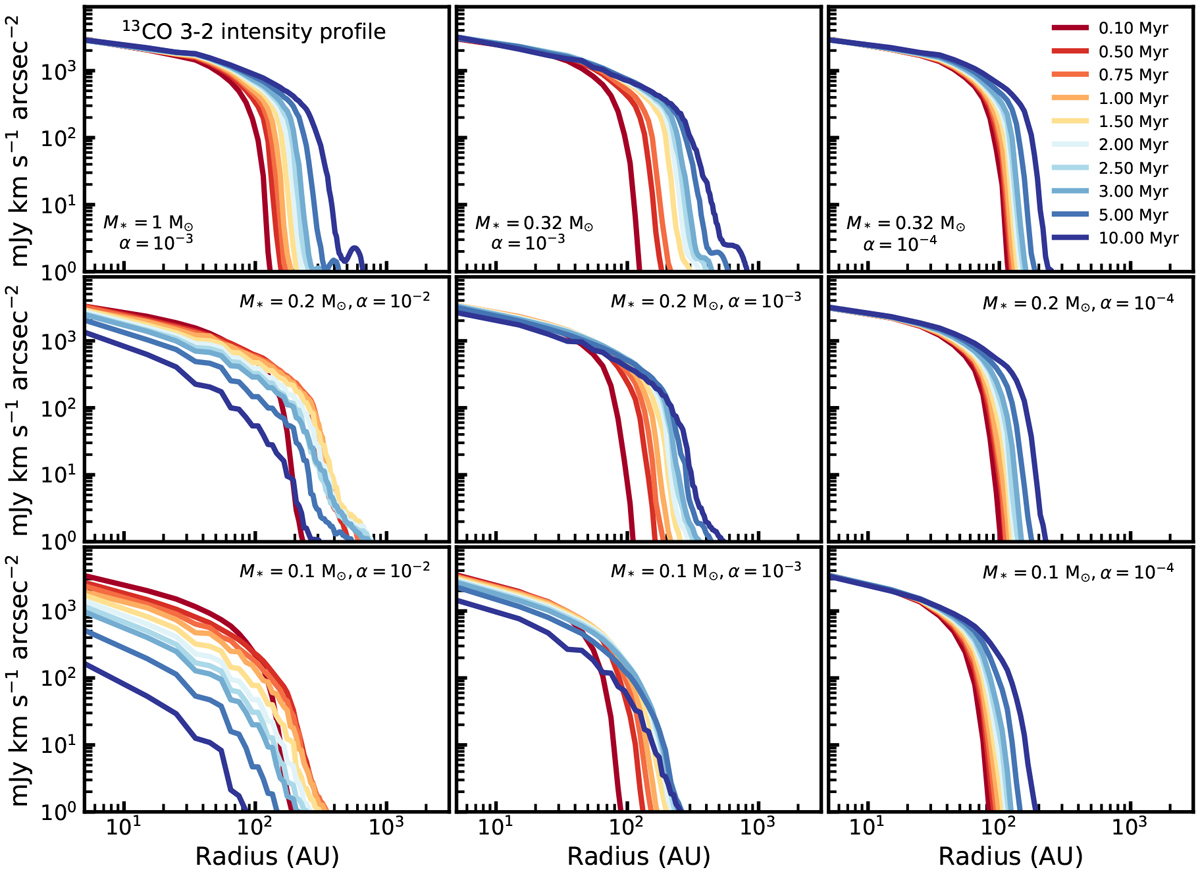
Time evolution of the 13CO J = 3−2 intensity profiles of our models, where colors denote different time steps. Each panel shows a different M* and αvisc.
Current usage metrics show cumulative count of Article Views (full-text article views including HTML views, PDF and ePub downloads, according to the available data) and Abstracts Views on Vision4Press platform.
Data correspond to usage on the plateform after 2015. The current usage metrics is available 48-96 hours after online publication and is updated daily on week days.
Initial download of the metrics may take a while.