Free Access
Fig. 8.
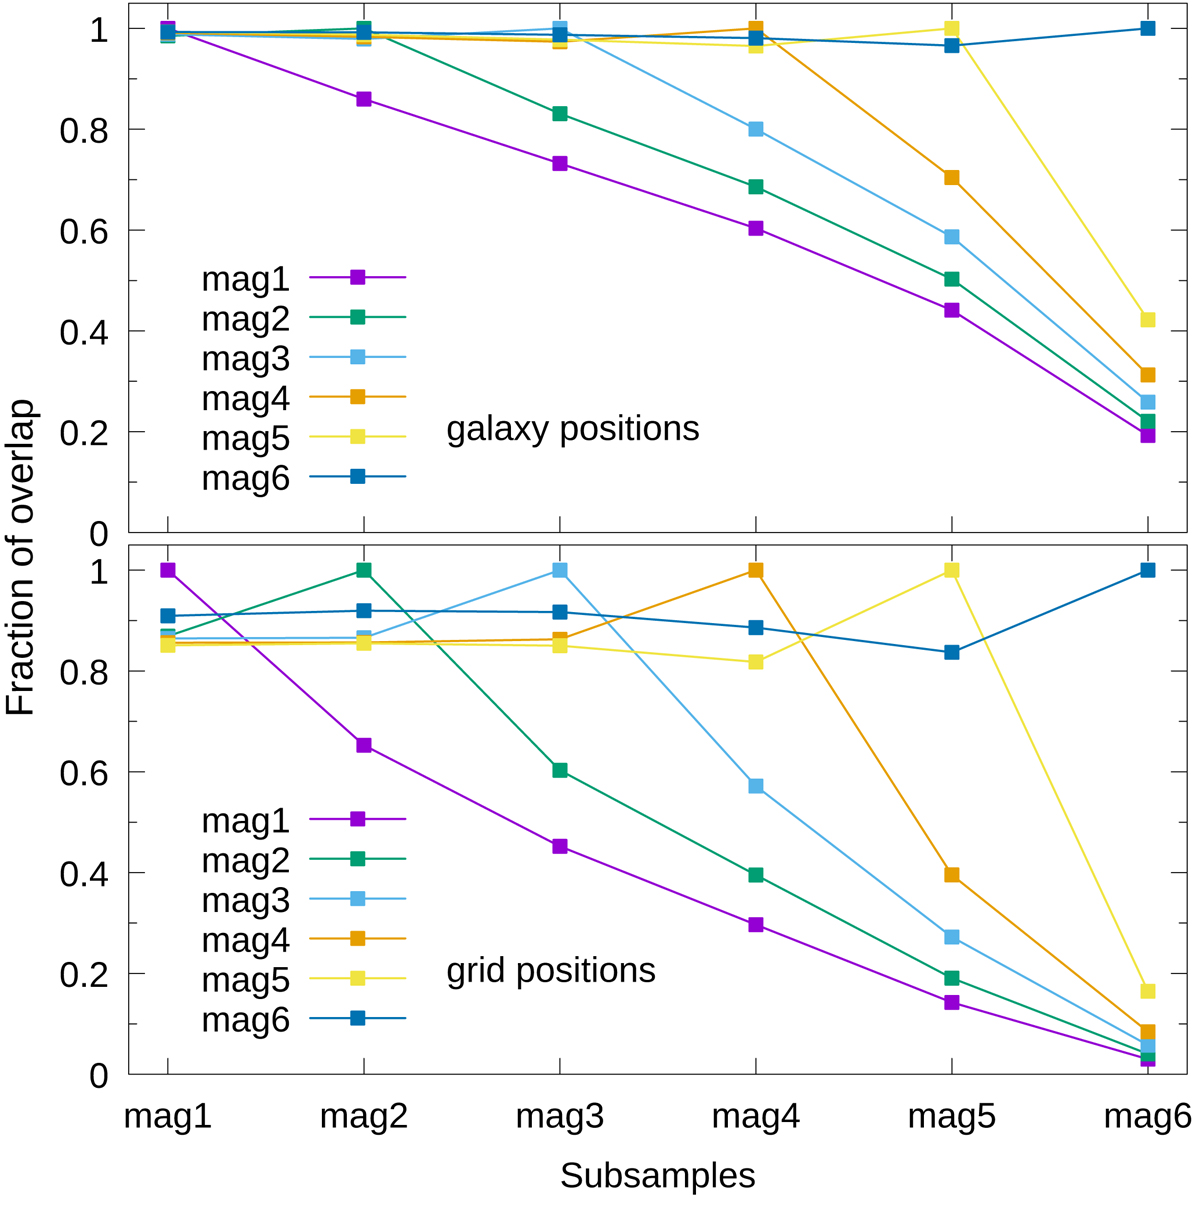
Overlap between filaments calculated using different subsamples compared at galaxy (upper panel) and grid (lower panel) positions. Lines show the fraction of subsample magN (line) filaments also present in the subsample magN′ (x-axis). The subsamples are defined in Table 1.
Current usage metrics show cumulative count of Article Views (full-text article views including HTML views, PDF and ePub downloads, according to the available data) and Abstracts Views on Vision4Press platform.
Data correspond to usage on the plateform after 2015. The current usage metrics is available 48-96 hours after online publication and is updated daily on week days.
Initial download of the metrics may take a while.