Fig. 7.
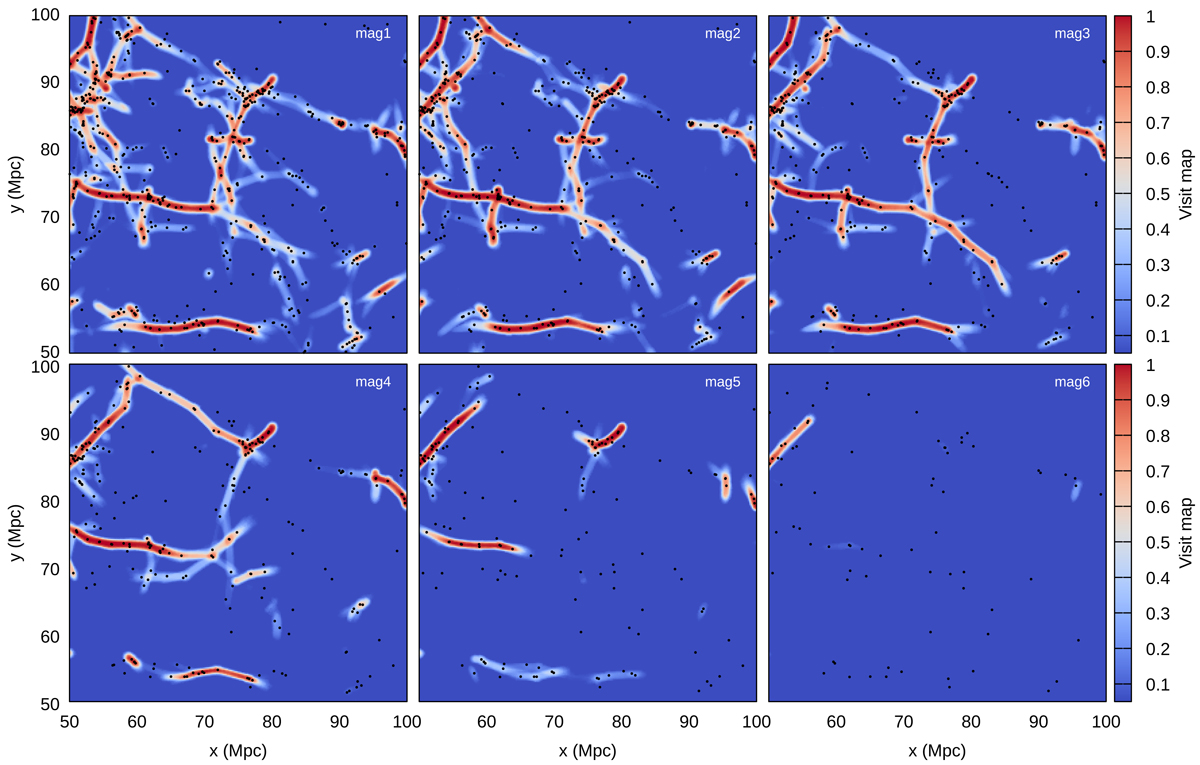
Visit map values at grid positions and galaxies for different subsamples. Each figure is a slice with the thickness of 10 Mpc and the visit map value shows the maximum value over z-axis. The galaxies that are used to calculate the visit maps are shown as black dots. All the figures depict the same coordinates in the various subsamples, showing how the filamentary networks obtained from different subsamples differ visually.
Current usage metrics show cumulative count of Article Views (full-text article views including HTML views, PDF and ePub downloads, according to the available data) and Abstracts Views on Vision4Press platform.
Data correspond to usage on the plateform after 2015. The current usage metrics is available 48-96 hours after online publication and is updated daily on week days.
Initial download of the metrics may take a while.