Fig. 5.
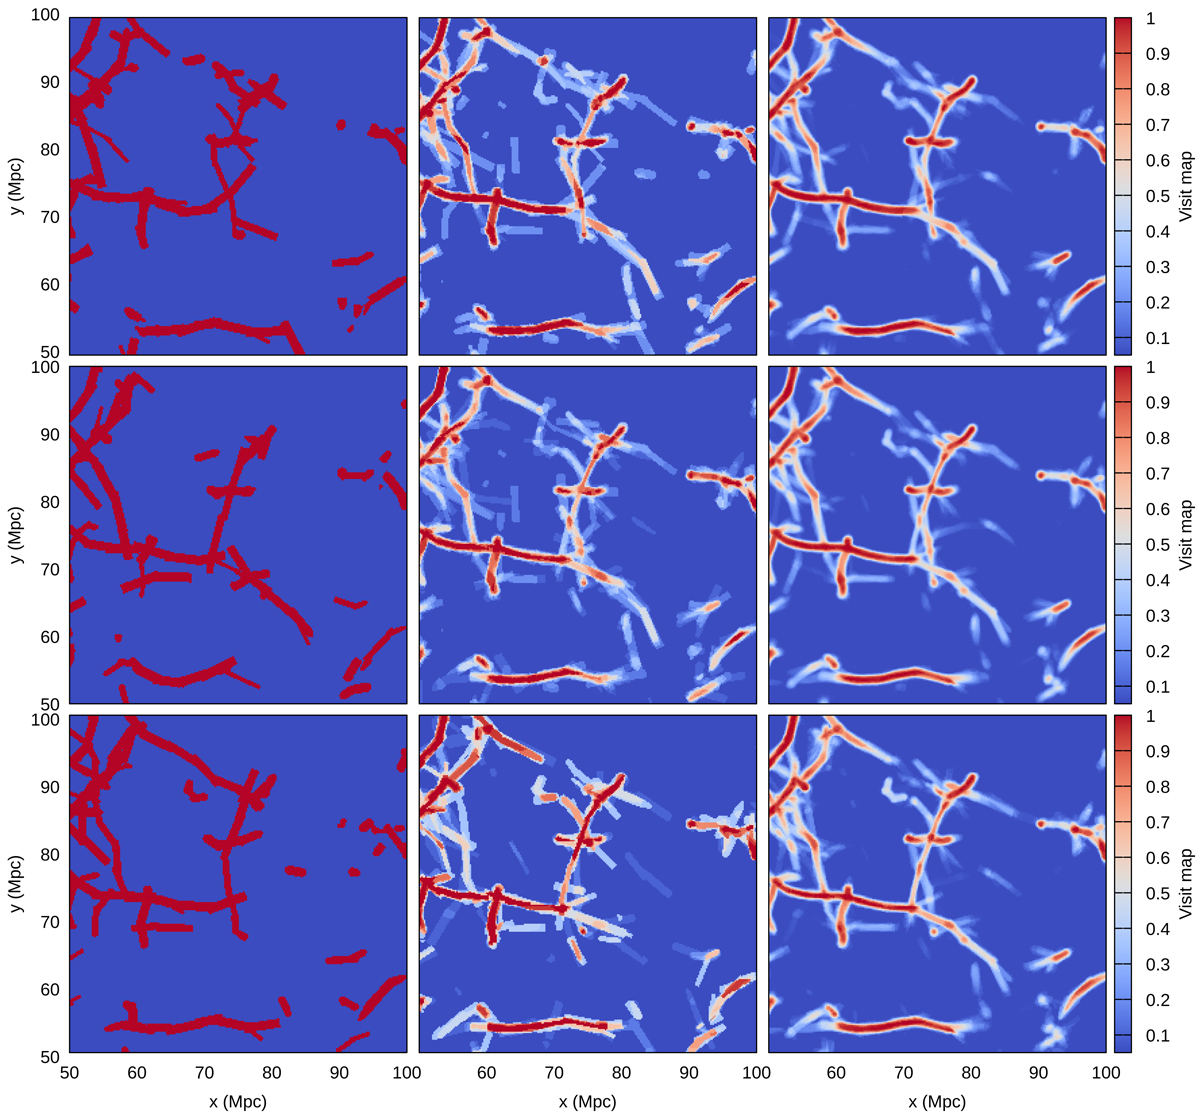
Maximum visit map value in a thin slice. The left column has a single realisation, the middle column 20 stacked realisations, and the right column 200 realisations of Bisous on mag2 subsample. Each row uses different realisations, which are used to construct the visit map. The thickness of slice is 10 Mpc and for clarity, only 50 × 502 Mpc region is shown. A single realisation can only have values of 1 or 0, and each single realisation contains only some features of the whole filamentary network. The more realisations used for the visit map the less variety there is between different visit maps. The rightmost panels have all the same features and differ only in minor details.
Current usage metrics show cumulative count of Article Views (full-text article views including HTML views, PDF and ePub downloads, according to the available data) and Abstracts Views on Vision4Press platform.
Data correspond to usage on the plateform after 2015. The current usage metrics is available 48-96 hours after online publication and is updated daily on week days.
Initial download of the metrics may take a while.