Fig. 10.
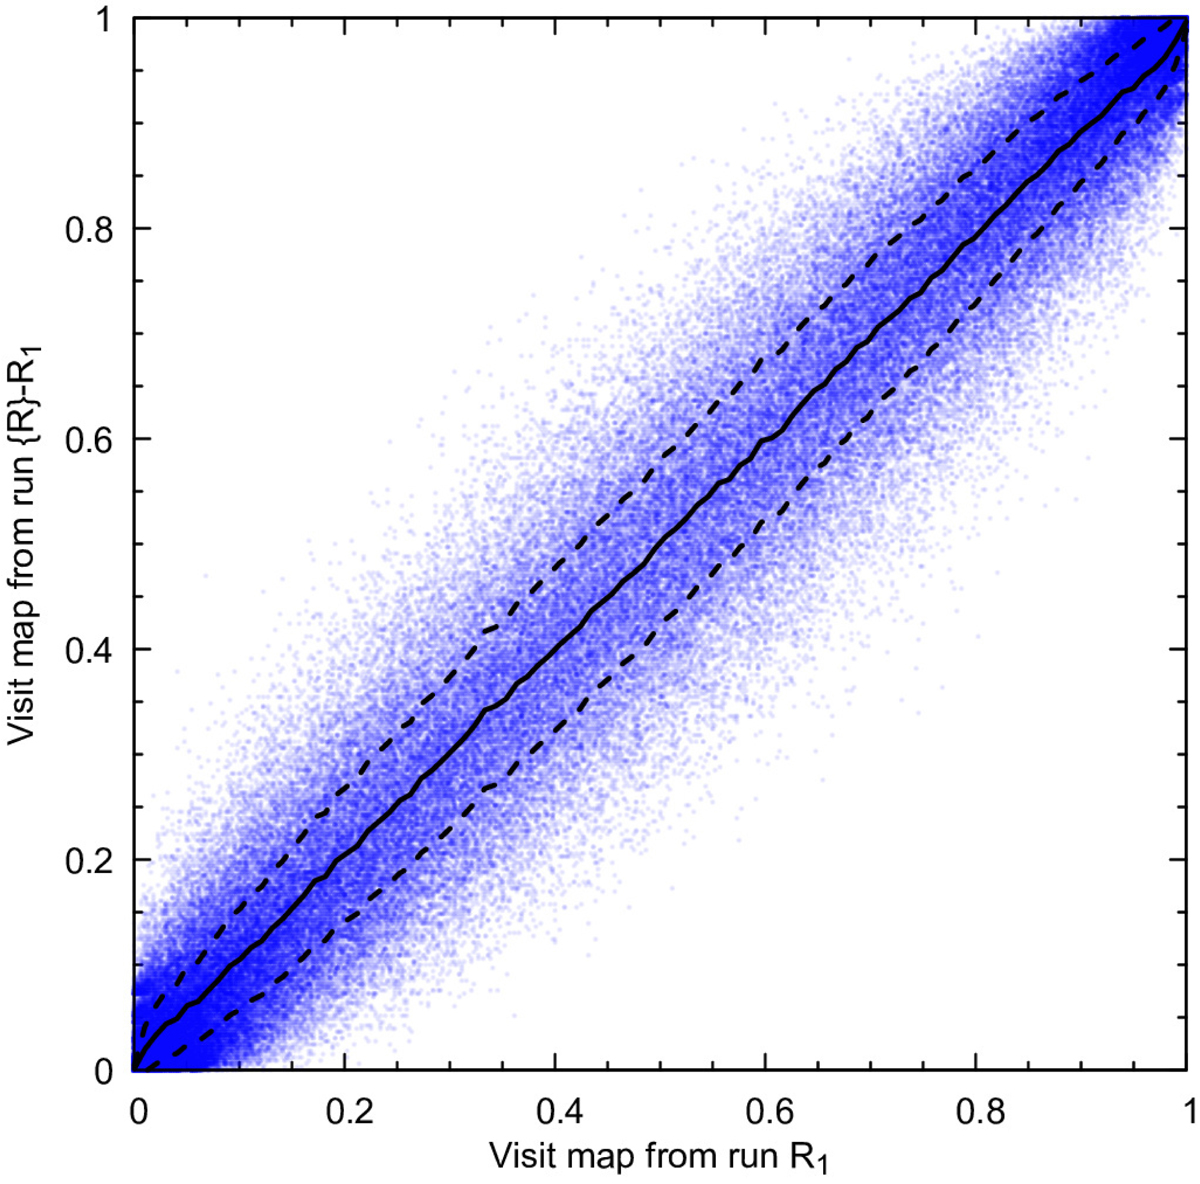
Comparison of the visit map values of a galaxy in different Bisous runs R. The horizontal axis has the visit map value of the galaxy from the first run R1, and all the other runs ![]() are scattered using their visit map value for the vertical axis and the first run for the horizontal axis. Every point on the figure represents a visit map value from a single run for a single galaxy. The solid line represents the mean and dashed lines ± σ values. Both mean and standard deviations are smoothed for visual clarity. The Pearson correlation coefficient is R = 0.98.
are scattered using their visit map value for the vertical axis and the first run for the horizontal axis. Every point on the figure represents a visit map value from a single run for a single galaxy. The solid line represents the mean and dashed lines ± σ values. Both mean and standard deviations are smoothed for visual clarity. The Pearson correlation coefficient is R = 0.98.
Current usage metrics show cumulative count of Article Views (full-text article views including HTML views, PDF and ePub downloads, according to the available data) and Abstracts Views on Vision4Press platform.
Data correspond to usage on the plateform after 2015. The current usage metrics is available 48-96 hours after online publication and is updated daily on week days.
Initial download of the metrics may take a while.