Fig. 9
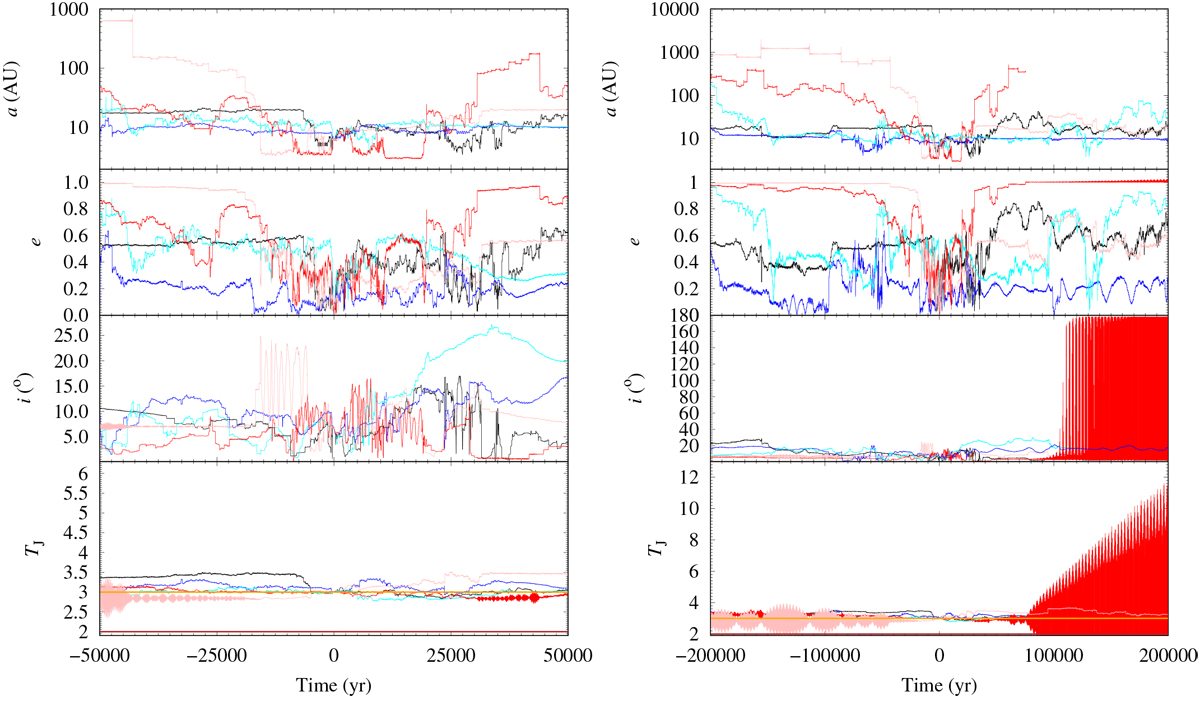
Short-term evolution of relevant parameters of 2020 MK4. Left panels: focus on a shorter time window but correspond to the same data shown in the right-hand side panels. Right panels: evolution of the semimajor axis, a (upper panels), of the nominal orbit (in black) as described by the orbit determination in Table 1 and those of control orbits or clones with Cartesian vectors separated +3σ (in blue), −3σ (in cyan), +9σ (in red), and −9σ (in pink) from the nominal values in Table C.1. The second from the top panels show the evolution of the eccentricity, e, for the same sample of control orbits. The second from the bottom panels display the inclination, i. The bottom panels show the variations of the Tisserand’s parameter, TJ and include the boundary references 2 (in brown) and 3 (in orange). The output time-step size is 20 yr, the origin of time is epoch 2459000.5 TDB.
Current usage metrics show cumulative count of Article Views (full-text article views including HTML views, PDF and ePub downloads, according to the available data) and Abstracts Views on Vision4Press platform.
Data correspond to usage on the plateform after 2015. The current usage metrics is available 48-96 hours after online publication and is updated daily on week days.
Initial download of the metrics may take a while.