Fig. 7
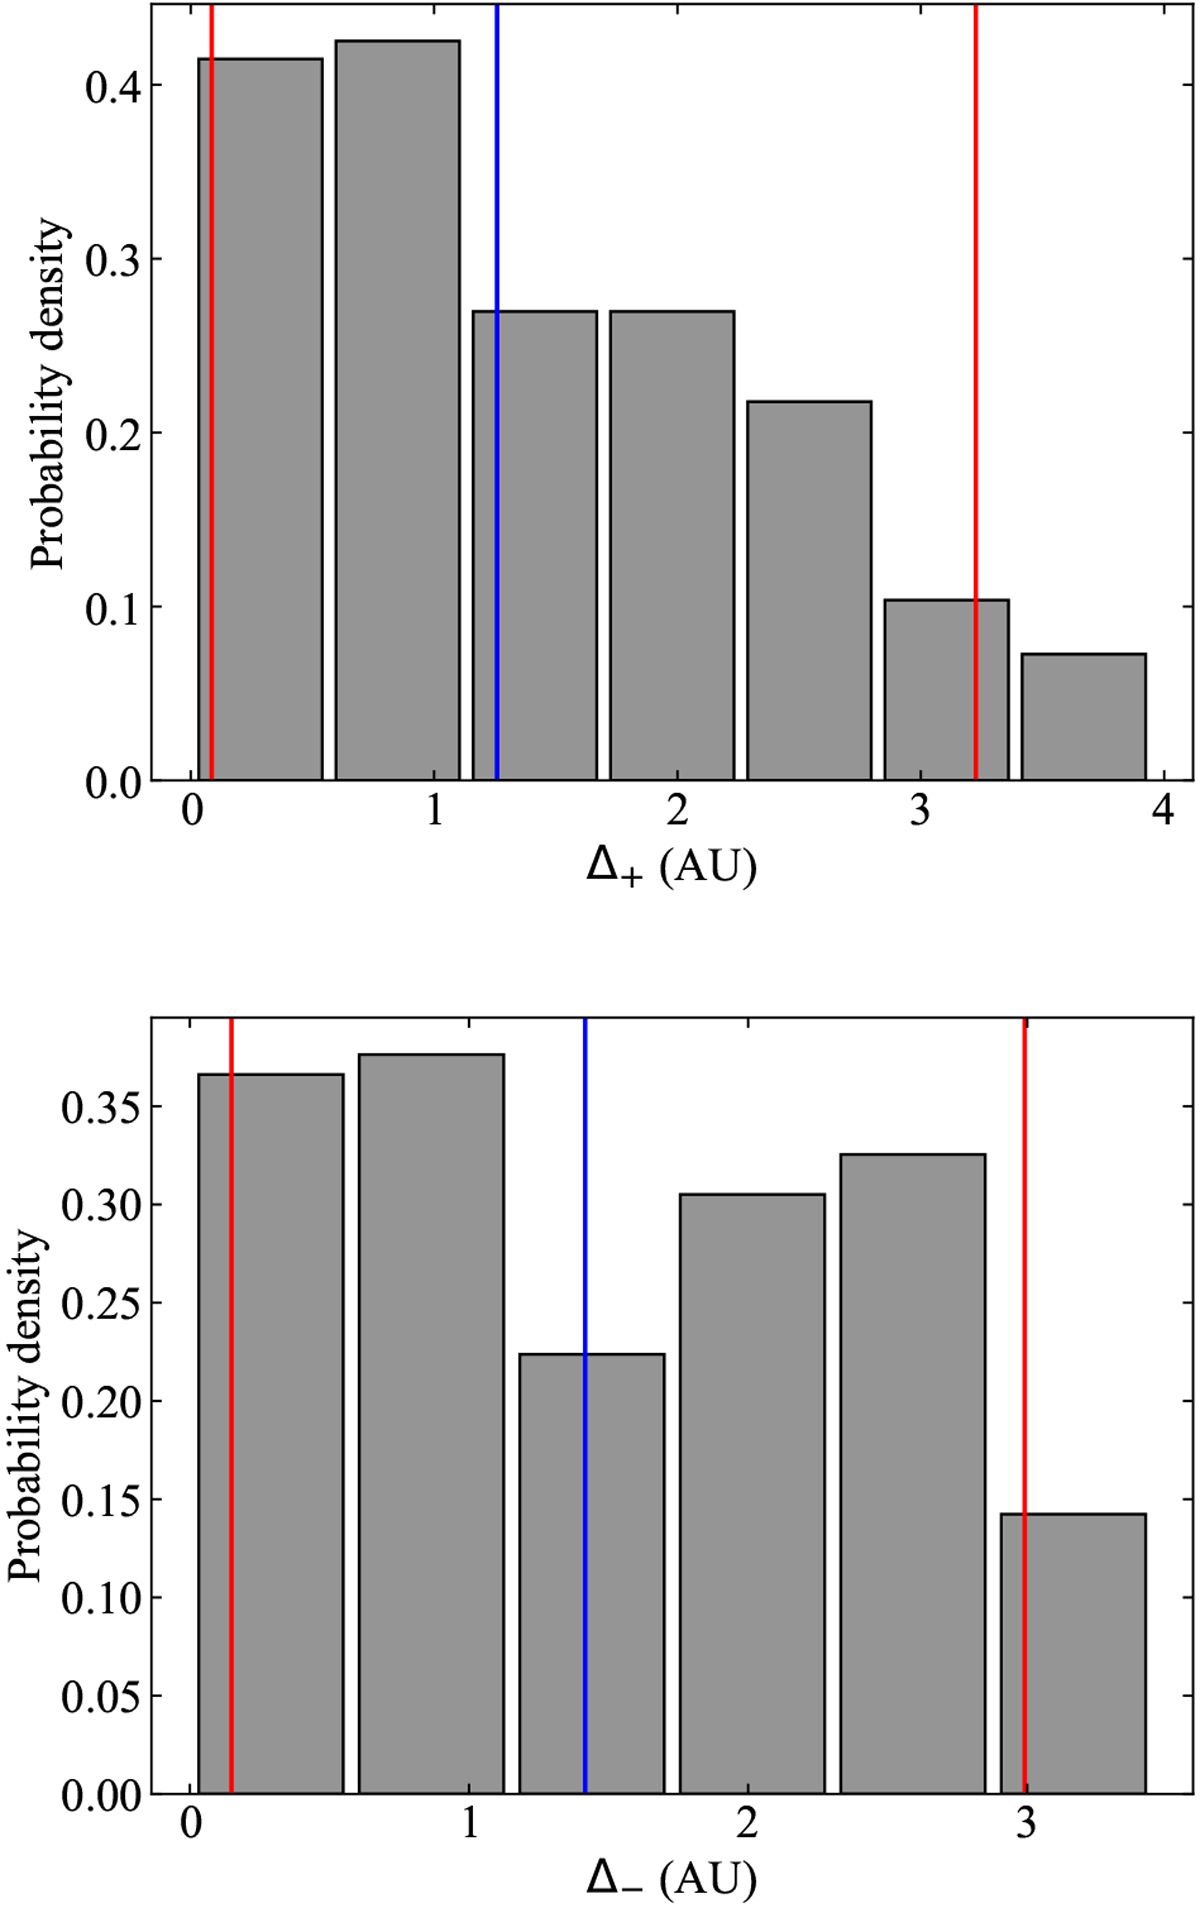
Distribution of mutual nodal distances. Upper panel: for the ascending mutual nodes of the sample of 19 NCs. The median is shown in blue and the 5th and 95th percentiles are in red. Bottom panel: for the descending mutual nodes of the same sample. In the histogram, we use bins computed using the Freedman and Diaconis rule (Freedman & Diaconis 1981) and counts to form a probability density so the area under the histogram will sum to one.
Current usage metrics show cumulative count of Article Views (full-text article views including HTML views, PDF and ePub downloads, according to the available data) and Abstracts Views on Vision4Press platform.
Data correspond to usage on the plateform after 2015. The current usage metrics is available 48-96 hours after online publication and is updated daily on week days.
Initial download of the metrics may take a while.