Fig. 2
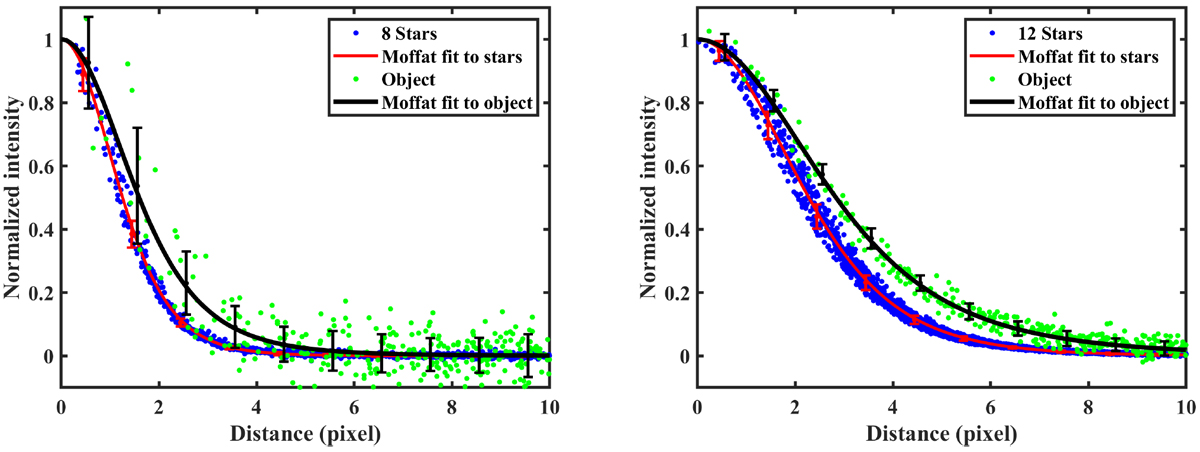
Profile analysis of the combined images of 2020 MK4 obtained onJuly 16 (left panel) and July 17 (right panel). Each plot contains the values of the normalized intensity as a function of the distance from the centroid (in pixels) for the stars (blue dots), the Moffat fit for the stars (red line), values of normalized intensity for the object (green dots), and the Moffat fit for the object (black line). Red bars correspond to the stars while black bars correspond to the object, and they are placed in the middle of the interval; an artificial offset in the x-axis was introduced to avoid overlapping symbols. It is important to notice that the profile of 2020 MK4 is significantly wider both nights, confirming that 2020 MK4 shows clear signs of cometary-like activity.
Current usage metrics show cumulative count of Article Views (full-text article views including HTML views, PDF and ePub downloads, according to the available data) and Abstracts Views on Vision4Press platform.
Data correspond to usage on the plateform after 2015. The current usage metrics is available 48-96 hours after online publication and is updated daily on week days.
Initial download of the metrics may take a while.