Fig. 15
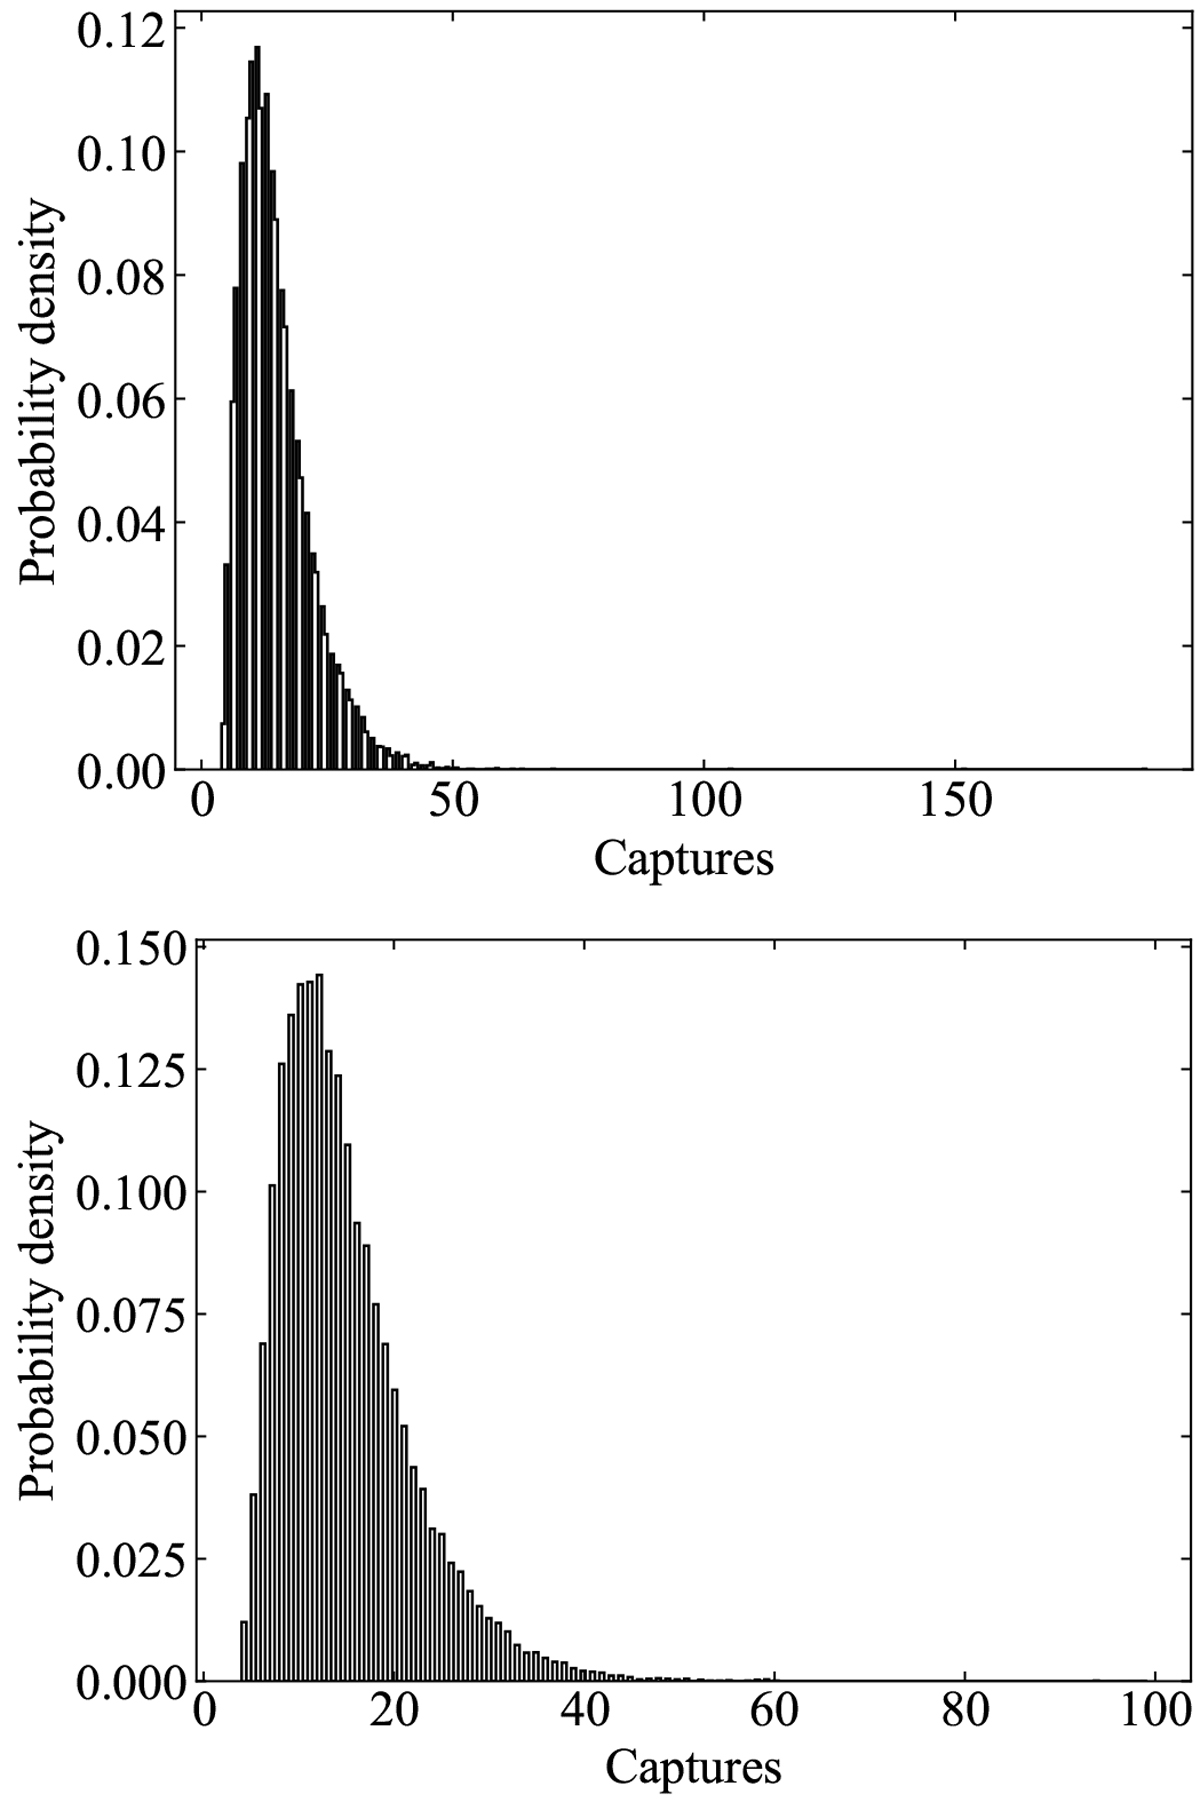
Distribution of the number of capture events by Jupiter per simulation. Upper panel: for 2020 MK4 and for comet 29P/Schwassmann-Wachmann 1 (bottom panel). The bins were computed using the Freedman and Diaconis rule implemented in NumPy (van der Walt et al. 2011; Harris et al. 2020). In the histogram, we use counts to form a probability density so the area under the histogram will sum to one.
Current usage metrics show cumulative count of Article Views (full-text article views including HTML views, PDF and ePub downloads, according to the available data) and Abstracts Views on Vision4Press platform.
Data correspond to usage on the plateform after 2015. The current usage metrics is available 48-96 hours after online publication and is updated daily on week days.
Initial download of the metrics may take a while.