Fig. 14
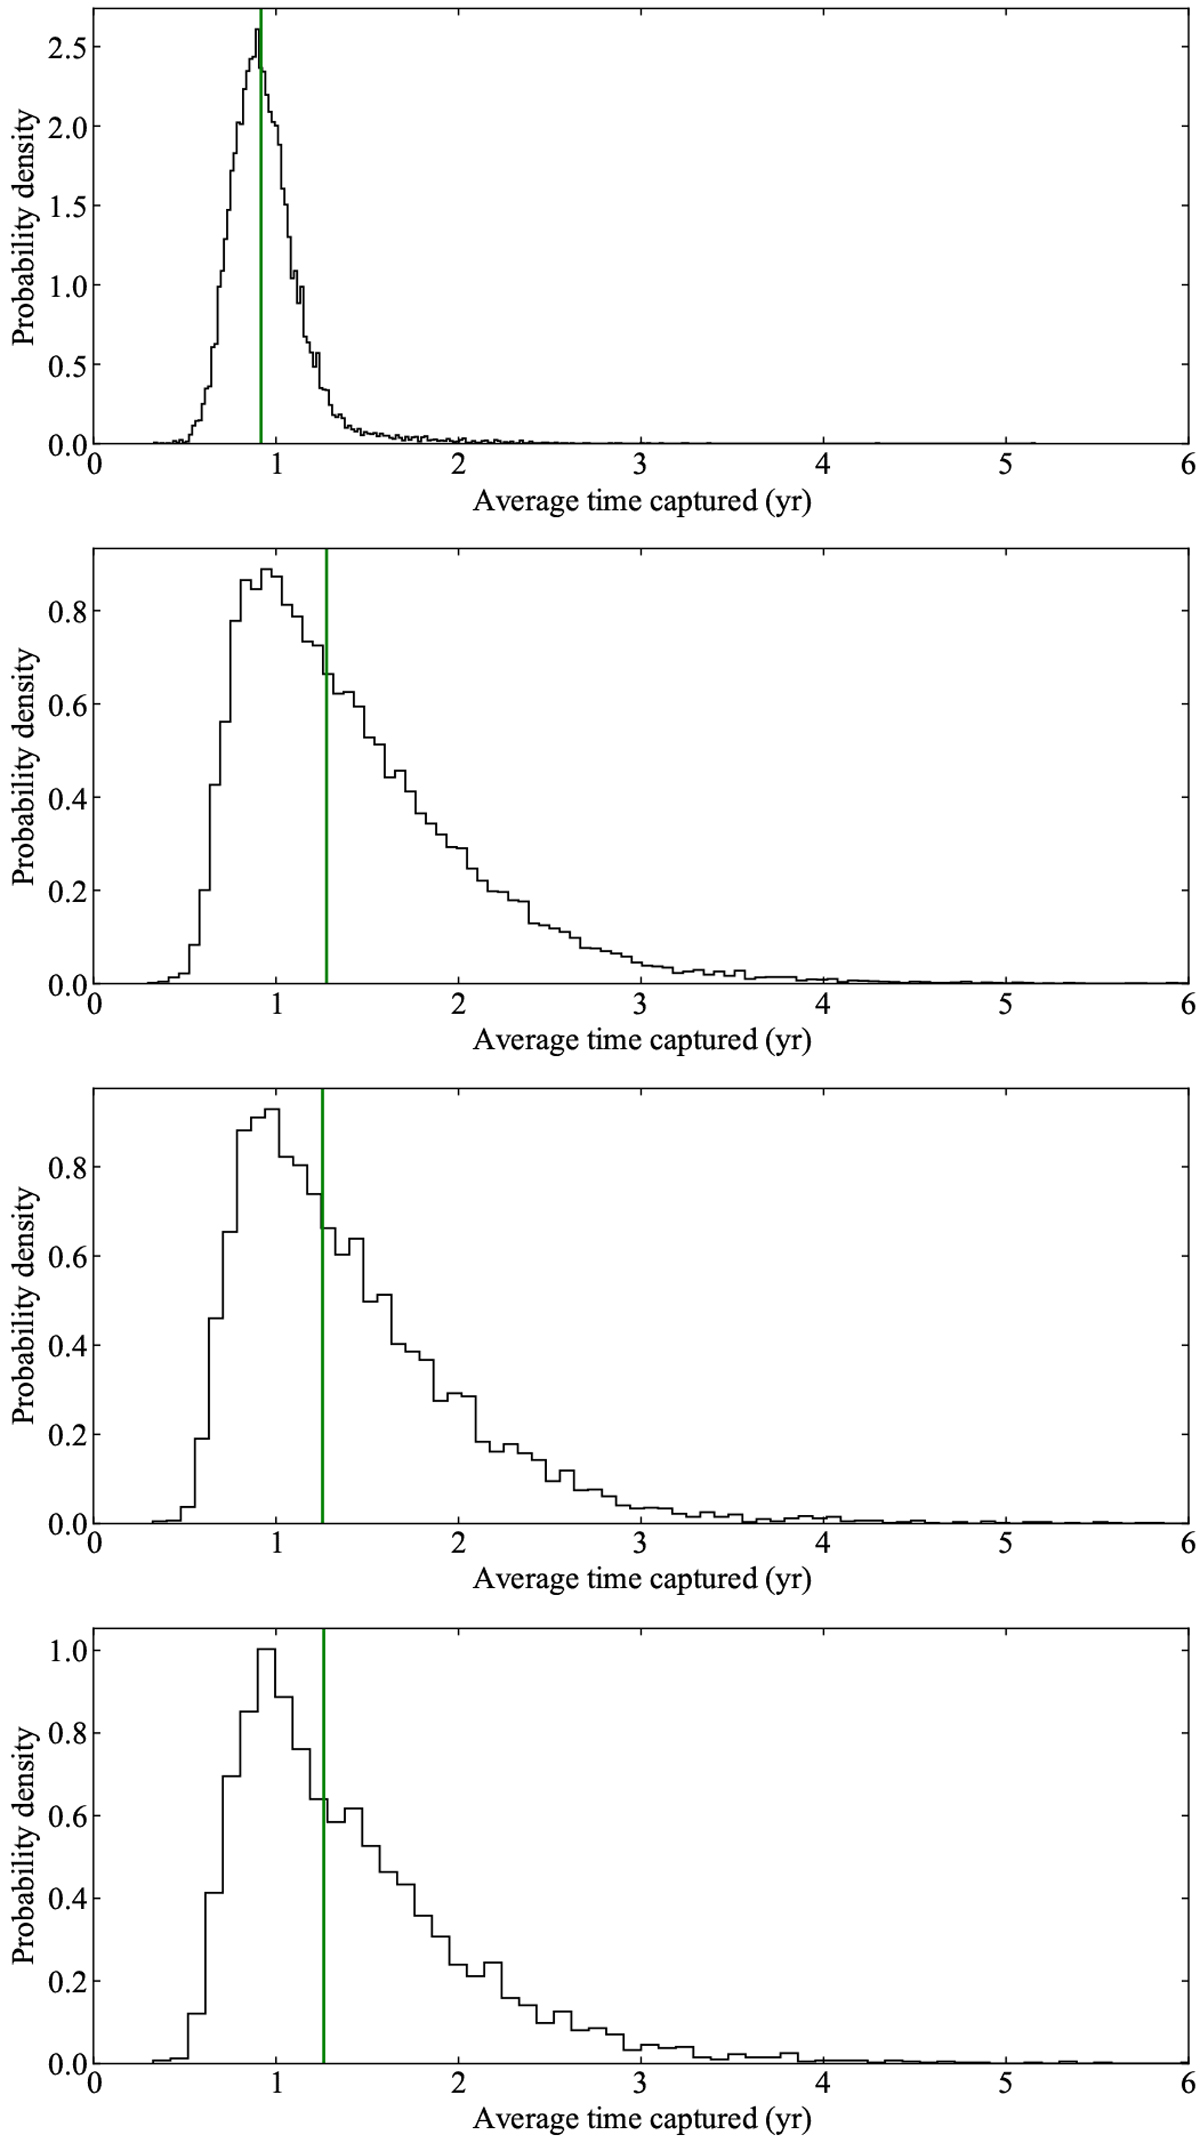
Distribution of average durations of temporary captures by Jupiter. Upper panel: for 2020 MK4, 29P/Schwassmann-Wachmann 1 (second to upper panel), P/2008 CL94 (Lemmon) (second to bottom panel), and P/2010 TO20 (LINEAR-Grauer) (bottom panel). Median values are displayed as vertical green lines. The bins were computed using the Freedman and Diaconis rule implemented in NumPy (van der Walt et al. 2011; Harris et al. 2020). In the histogram, we use counts to form a probability density so the area under the histogram will sum to one.
Current usage metrics show cumulative count of Article Views (full-text article views including HTML views, PDF and ePub downloads, according to the available data) and Abstracts Views on Vision4Press platform.
Data correspond to usage on the plateform after 2015. The current usage metrics is available 48-96 hours after online publication and is updated daily on week days.
Initial download of the metrics may take a while.