Fig. 16.
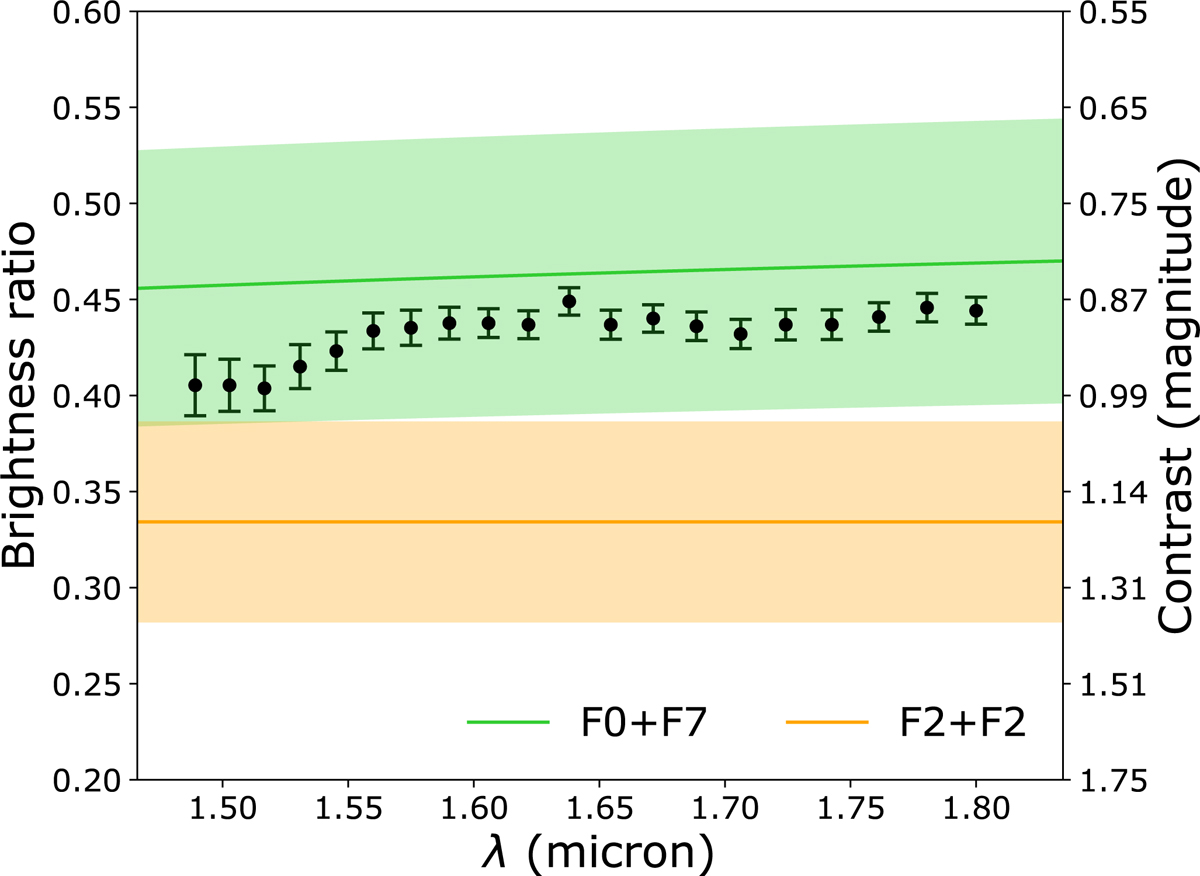
Recovered brightness ratio of the binary as a function of wavelength. The green line shows the expected brightness ratio for the spectral types (F0 and F7) reported by Cvetković et al. (2016). The orange line is the expected brightness ratio when both components are of type F2. The envelopes represent the 1σ error from the V-band and I-band measurements presented in Table 2. The number of data points is larger than the number of independent measurements (∼4).
Current usage metrics show cumulative count of Article Views (full-text article views including HTML views, PDF and ePub downloads, according to the available data) and Abstracts Views on Vision4Press platform.
Data correspond to usage on the plateform after 2015. The current usage metrics is available 48-96 hours after online publication and is updated daily on week days.
Initial download of the metrics may take a while.