Fig. 15.
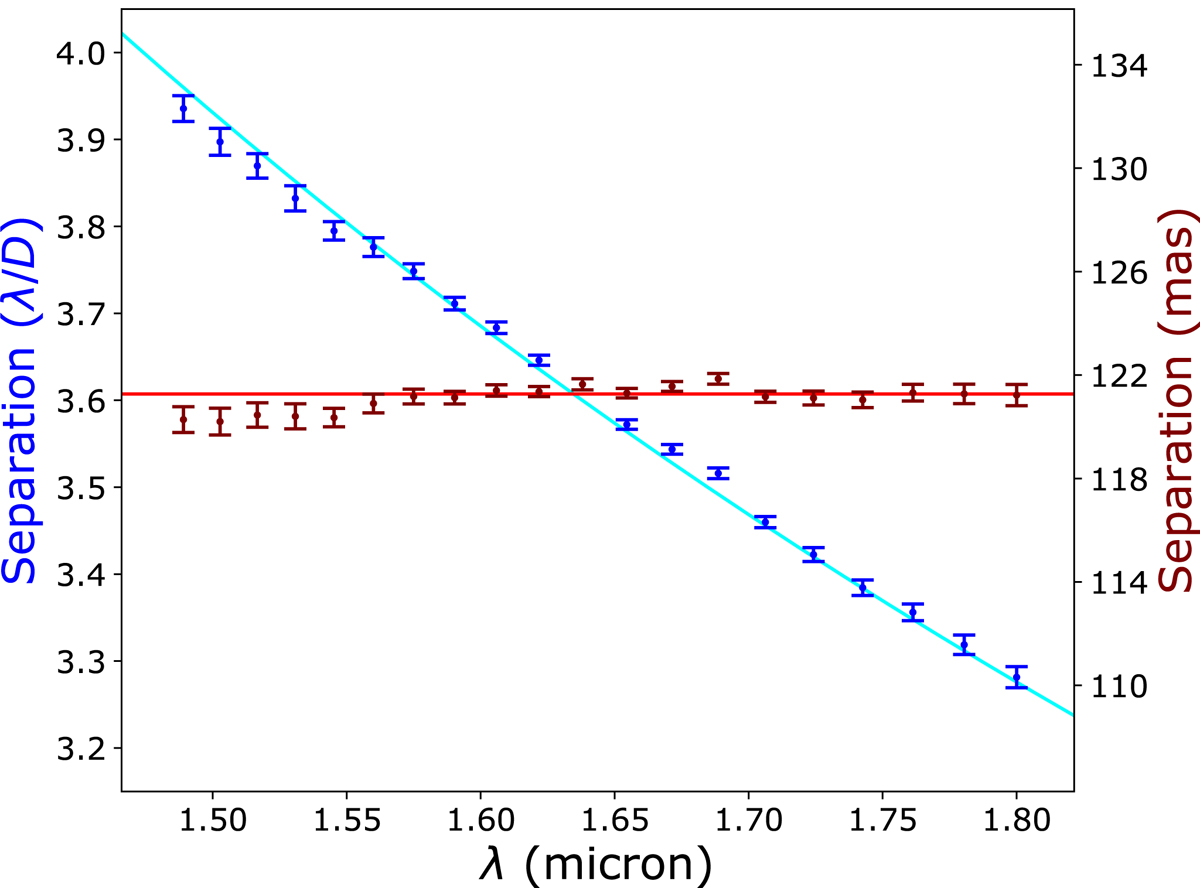
Separation between the components of HD 90823 inferred with HAM as a function of wavelength, expressed in units of λ/D (blue points) and expressed in milliarcseconds (red points). The blue line is proportional to 1/λ. The red line is a weighted average of the measured separations in milliarcseconds. The number of data points is larger than the number of independent measurements (∼4).
Current usage metrics show cumulative count of Article Views (full-text article views including HTML views, PDF and ePub downloads, according to the available data) and Abstracts Views on Vision4Press platform.
Data correspond to usage on the plateform after 2015. The current usage metrics is available 48-96 hours after online publication and is updated daily on week days.
Initial download of the metrics may take a while.