Fig. 9.
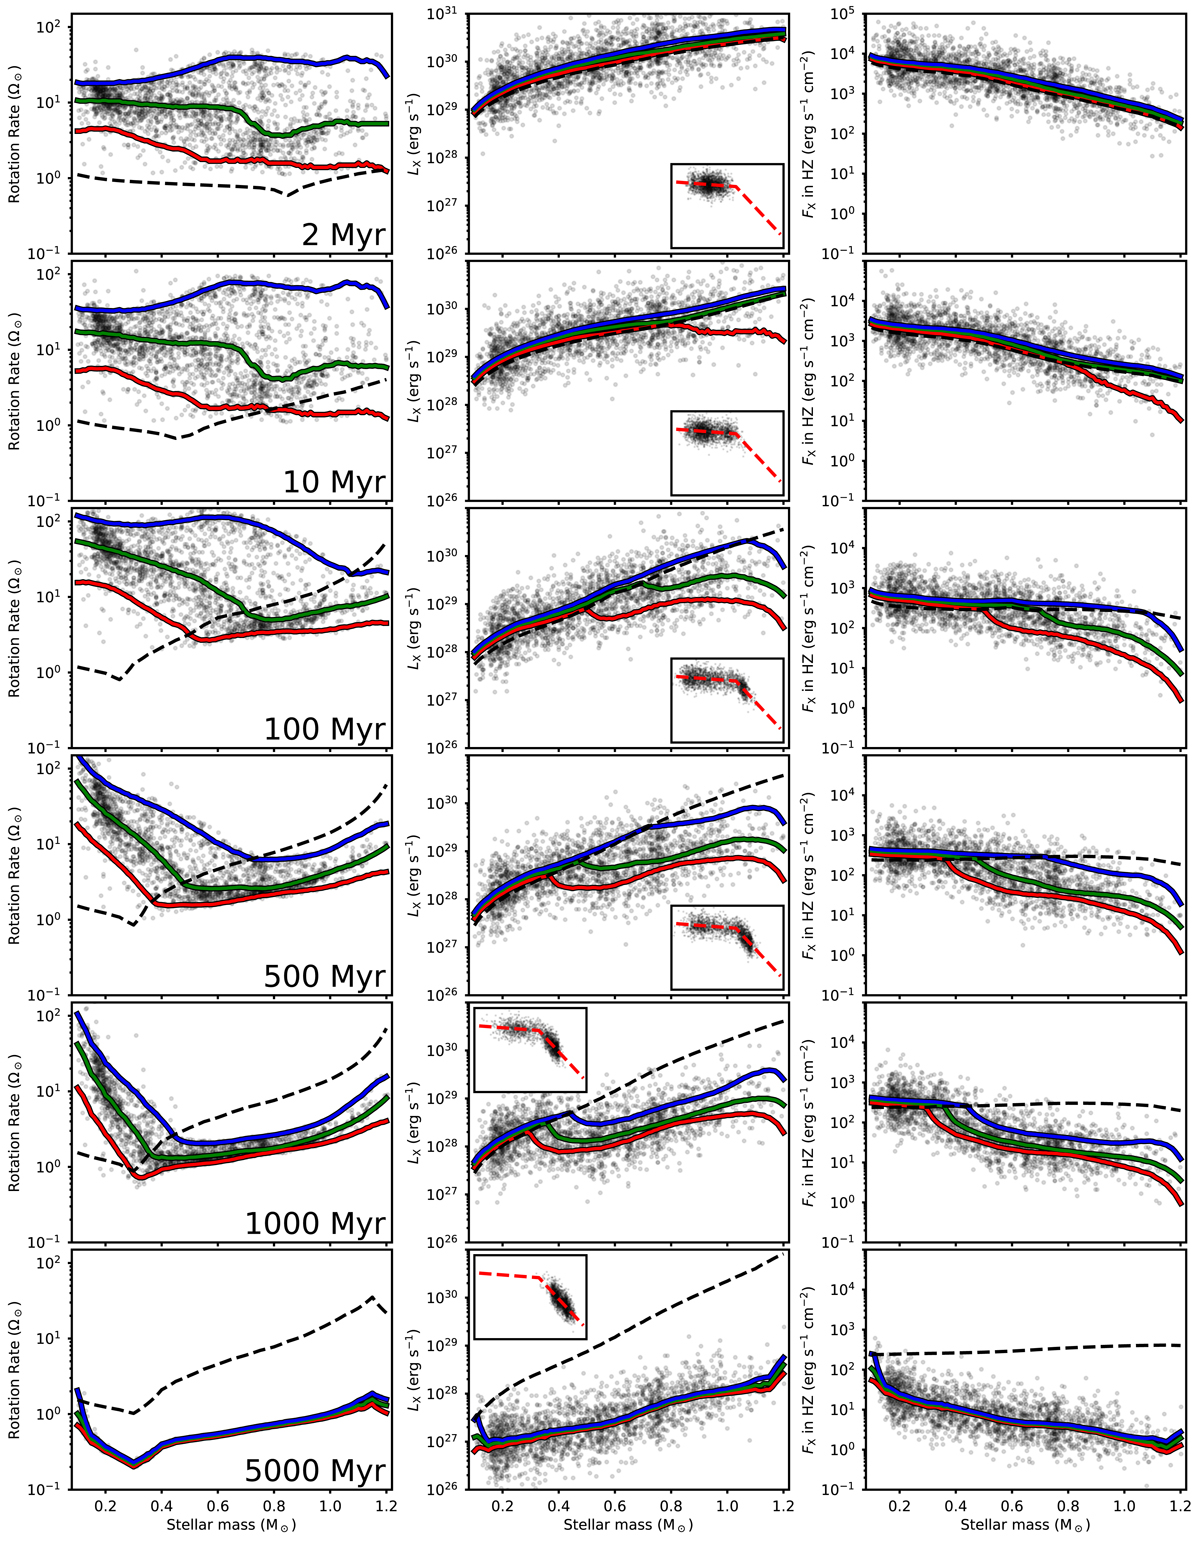
Evolution of the distributions of rotation (left-column), X-ray luminosity (middle-column), and X-ray flux in the habitable zone (right-column) against stellar mass, with each row showing the ages labelled in the left column. In each panel, the black circles show the model distribution, the red, green, and blue lines show the values for the slow, medium, and fast rotator cases, and the dashed black line shows the saturation threshold values. In the middle column, the insets show RX against Ro for the model distribution, with the red line showing the empirical relation given by Eq. (17). The X-ray flux in the habitable zone is defined as the flux at an orbital distance half-way between the moist and maximum greenhouse limits and these limits are calculated at all ages assuming the stellar properties at 5 Gyr.
Current usage metrics show cumulative count of Article Views (full-text article views including HTML views, PDF and ePub downloads, according to the available data) and Abstracts Views on Vision4Press platform.
Data correspond to usage on the plateform after 2015. The current usage metrics is available 48-96 hours after online publication and is updated daily on week days.
Initial download of the metrics may take a while.