Fig. 8.
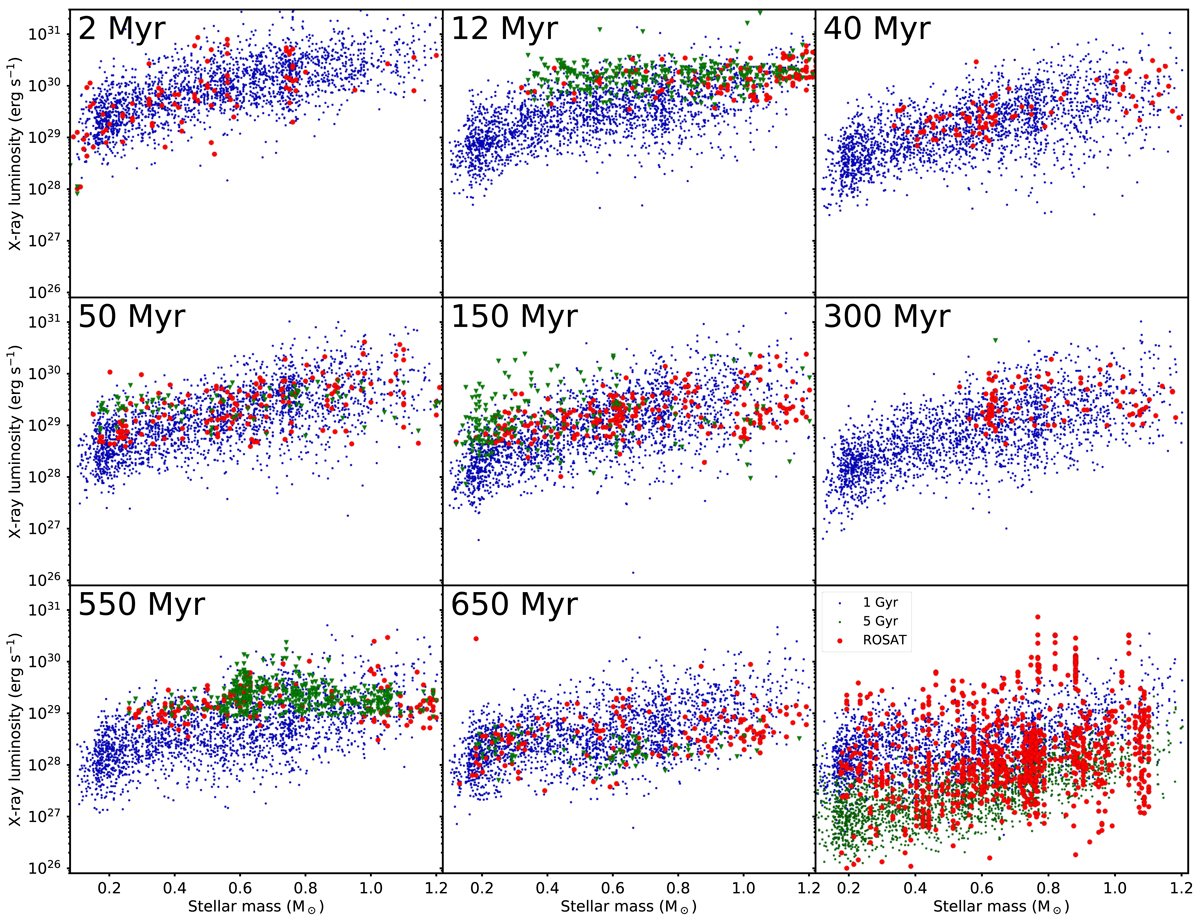
Comparison between stellar X-ray luminosity distributions for several young clusters and our predicted distributions at these ages. In each panel, the blue circles shows our model distribution, the red circles show measured values, and the green triangles show upper limits. The final panel shows X-ray luminosities determined by ROSAT for nearby field stars (red circles) compared to our model distributions at ages of 1 and 5 Gyr.
Current usage metrics show cumulative count of Article Views (full-text article views including HTML views, PDF and ePub downloads, according to the available data) and Abstracts Views on Vision4Press platform.
Data correspond to usage on the plateform after 2015. The current usage metrics is available 48-96 hours after online publication and is updated daily on week days.
Initial download of the metrics may take a while.