Fig. 7.
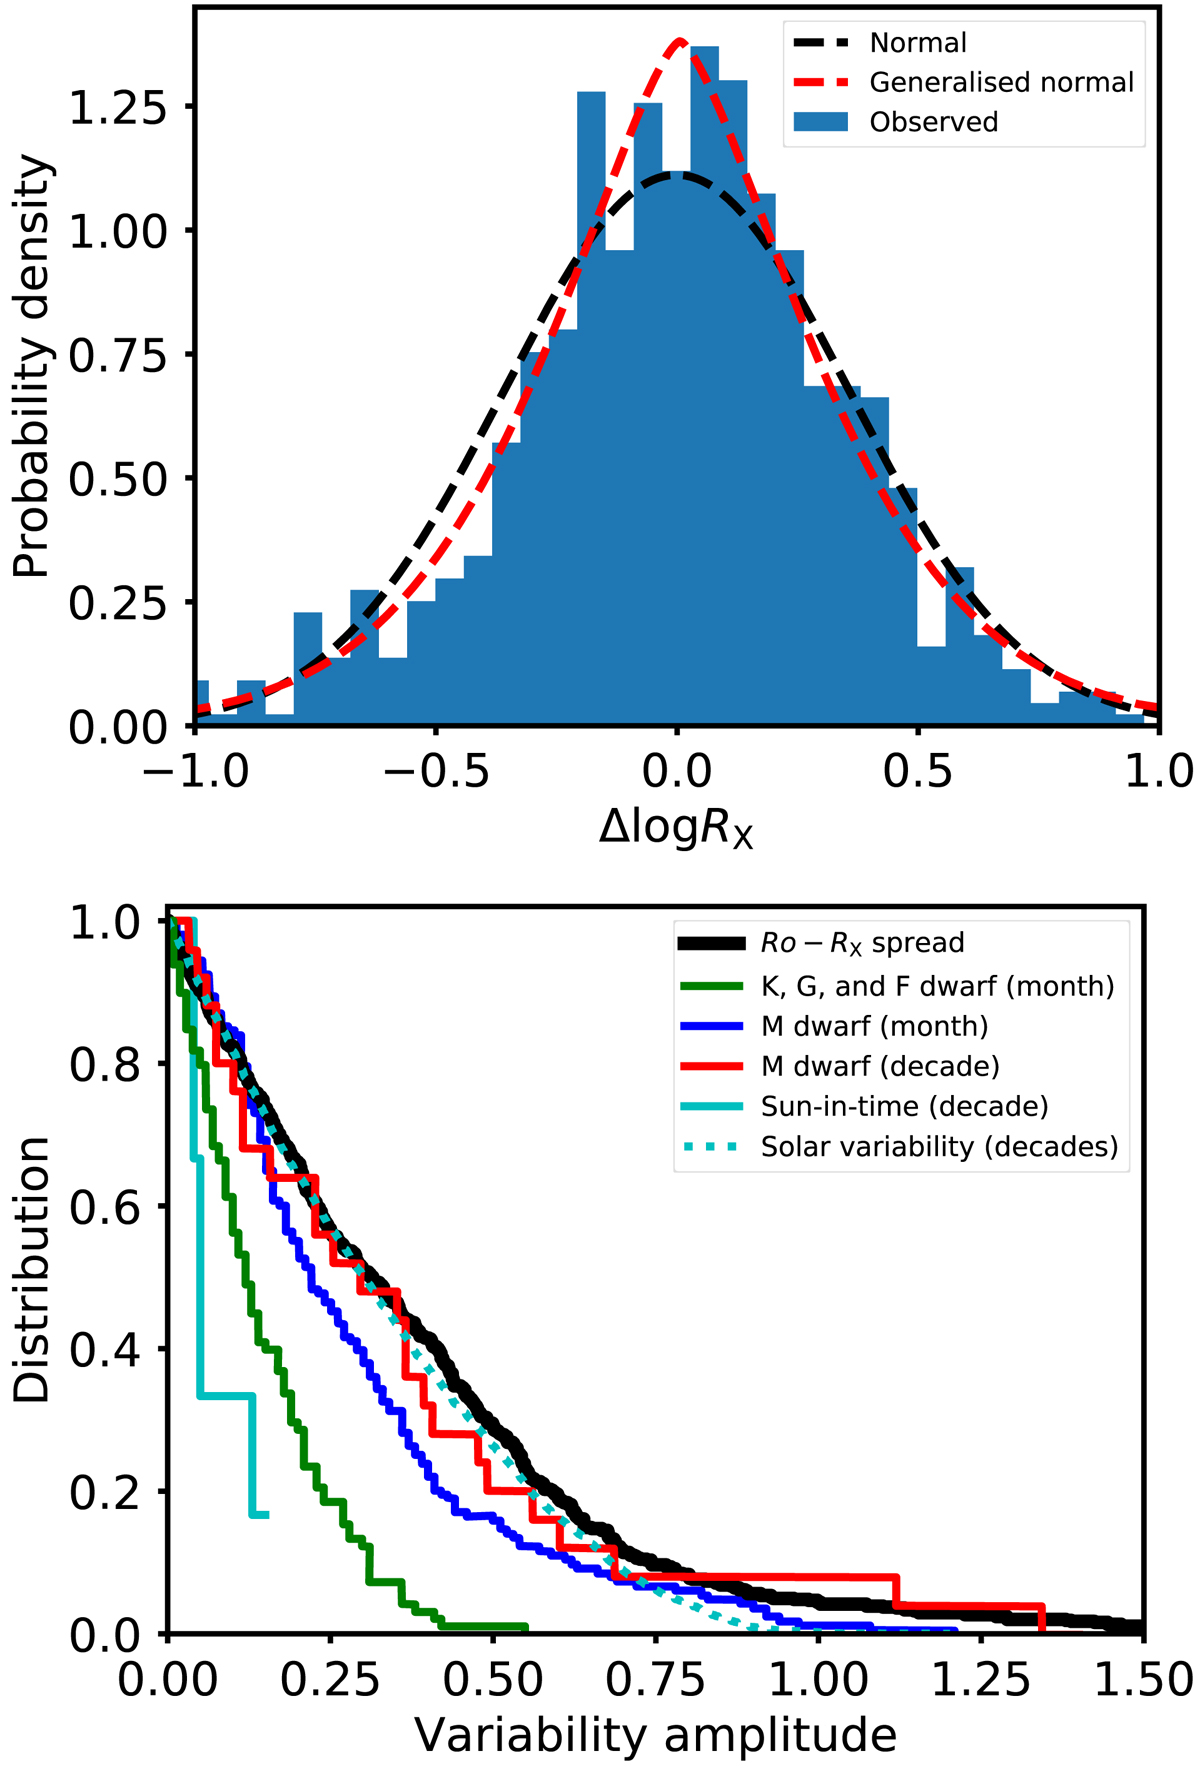
Upper panel: histogram showing the distribution of Δ log RX, defined as the difference between the log of the observed RX and the log of the RX from our fit formula. The black line shows a normal distribution with μ = 0 and σ = 0.359 and the red line shows the generalised normal distribution with a probability density function given by βexp[−(|Δlog RX−μ|/α)β]/[2αΓ(1/β)], where β = 1.43, μ = 0, α = 0.4, and Γ is the gamma-function. Lower panel: cumulative distribution functions for the variability amplitudes of several samples of stellar LX measurements. The black line represents the spread in the Ro–RX distribution, the dotted line represents variability of the Sun, and the other lines show variability distributions derived from the literature as described in Sect. 3.2.
Current usage metrics show cumulative count of Article Views (full-text article views including HTML views, PDF and ePub downloads, according to the available data) and Abstracts Views on Vision4Press platform.
Data correspond to usage on the plateform after 2015. The current usage metrics is available 48-96 hours after online publication and is updated daily on week days.
Initial download of the metrics may take a while.