Fig. 6.
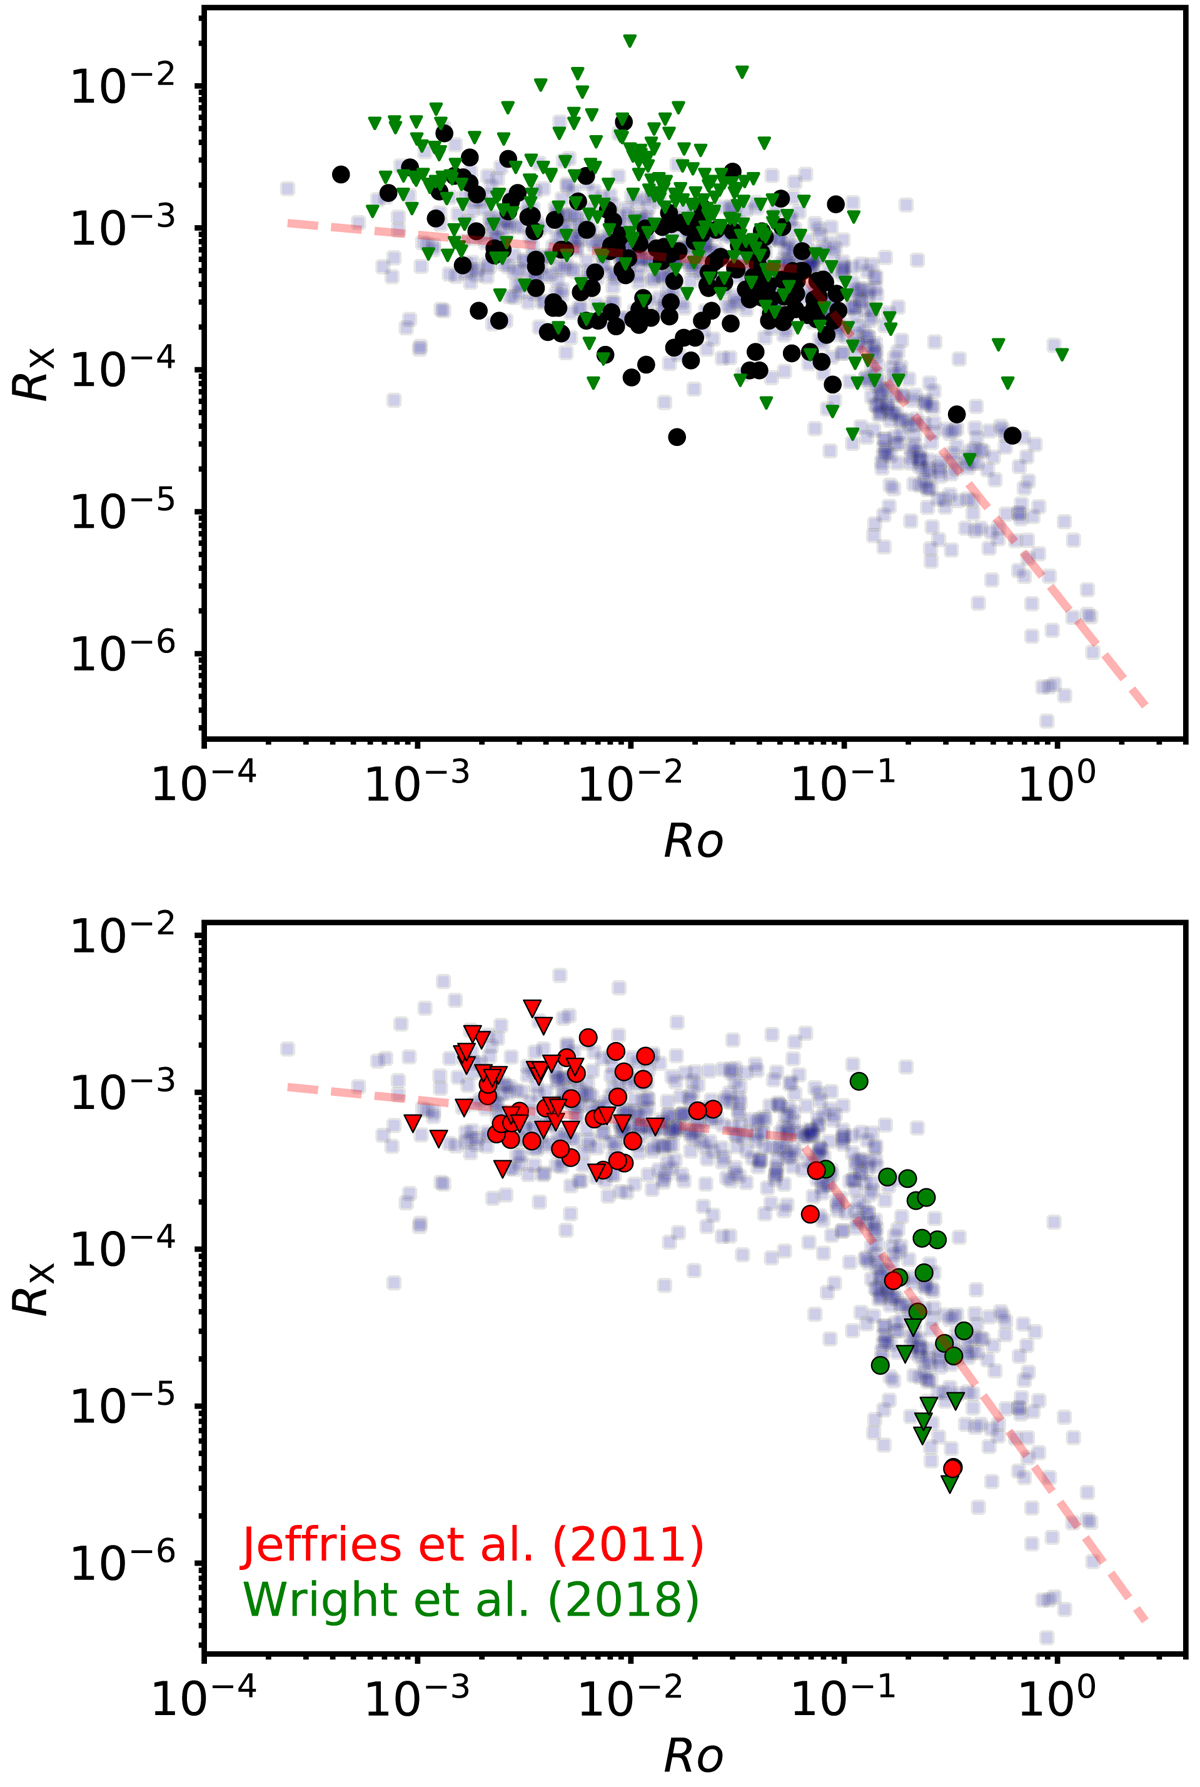
Upper panel: comparison of the Ro–RX distribution shown in Fig. 4 with the stars in the ∼12 Myr cluster h Per with the black circles and green triangles showing X-ray detections and upper limits from Argiroffi et al. (2016). We recalculate the Rossby numbers using the convective turnover times given by Spada et al. (2013) assuming an age of 12 Myr. Lower panel: comparison of the Ro–RX distribution shown in Fig. 4 with a sample of fully convective M dwarfs from Jeffries et al. (2011) and Wright et al. (2018), with detections and upper limits shown as circles and triangles.
Current usage metrics show cumulative count of Article Views (full-text article views including HTML views, PDF and ePub downloads, according to the available data) and Abstracts Views on Vision4Press platform.
Data correspond to usage on the plateform after 2015. The current usage metrics is available 48-96 hours after online publication and is updated daily on week days.
Initial download of the metrics may take a while.