Fig. 5.
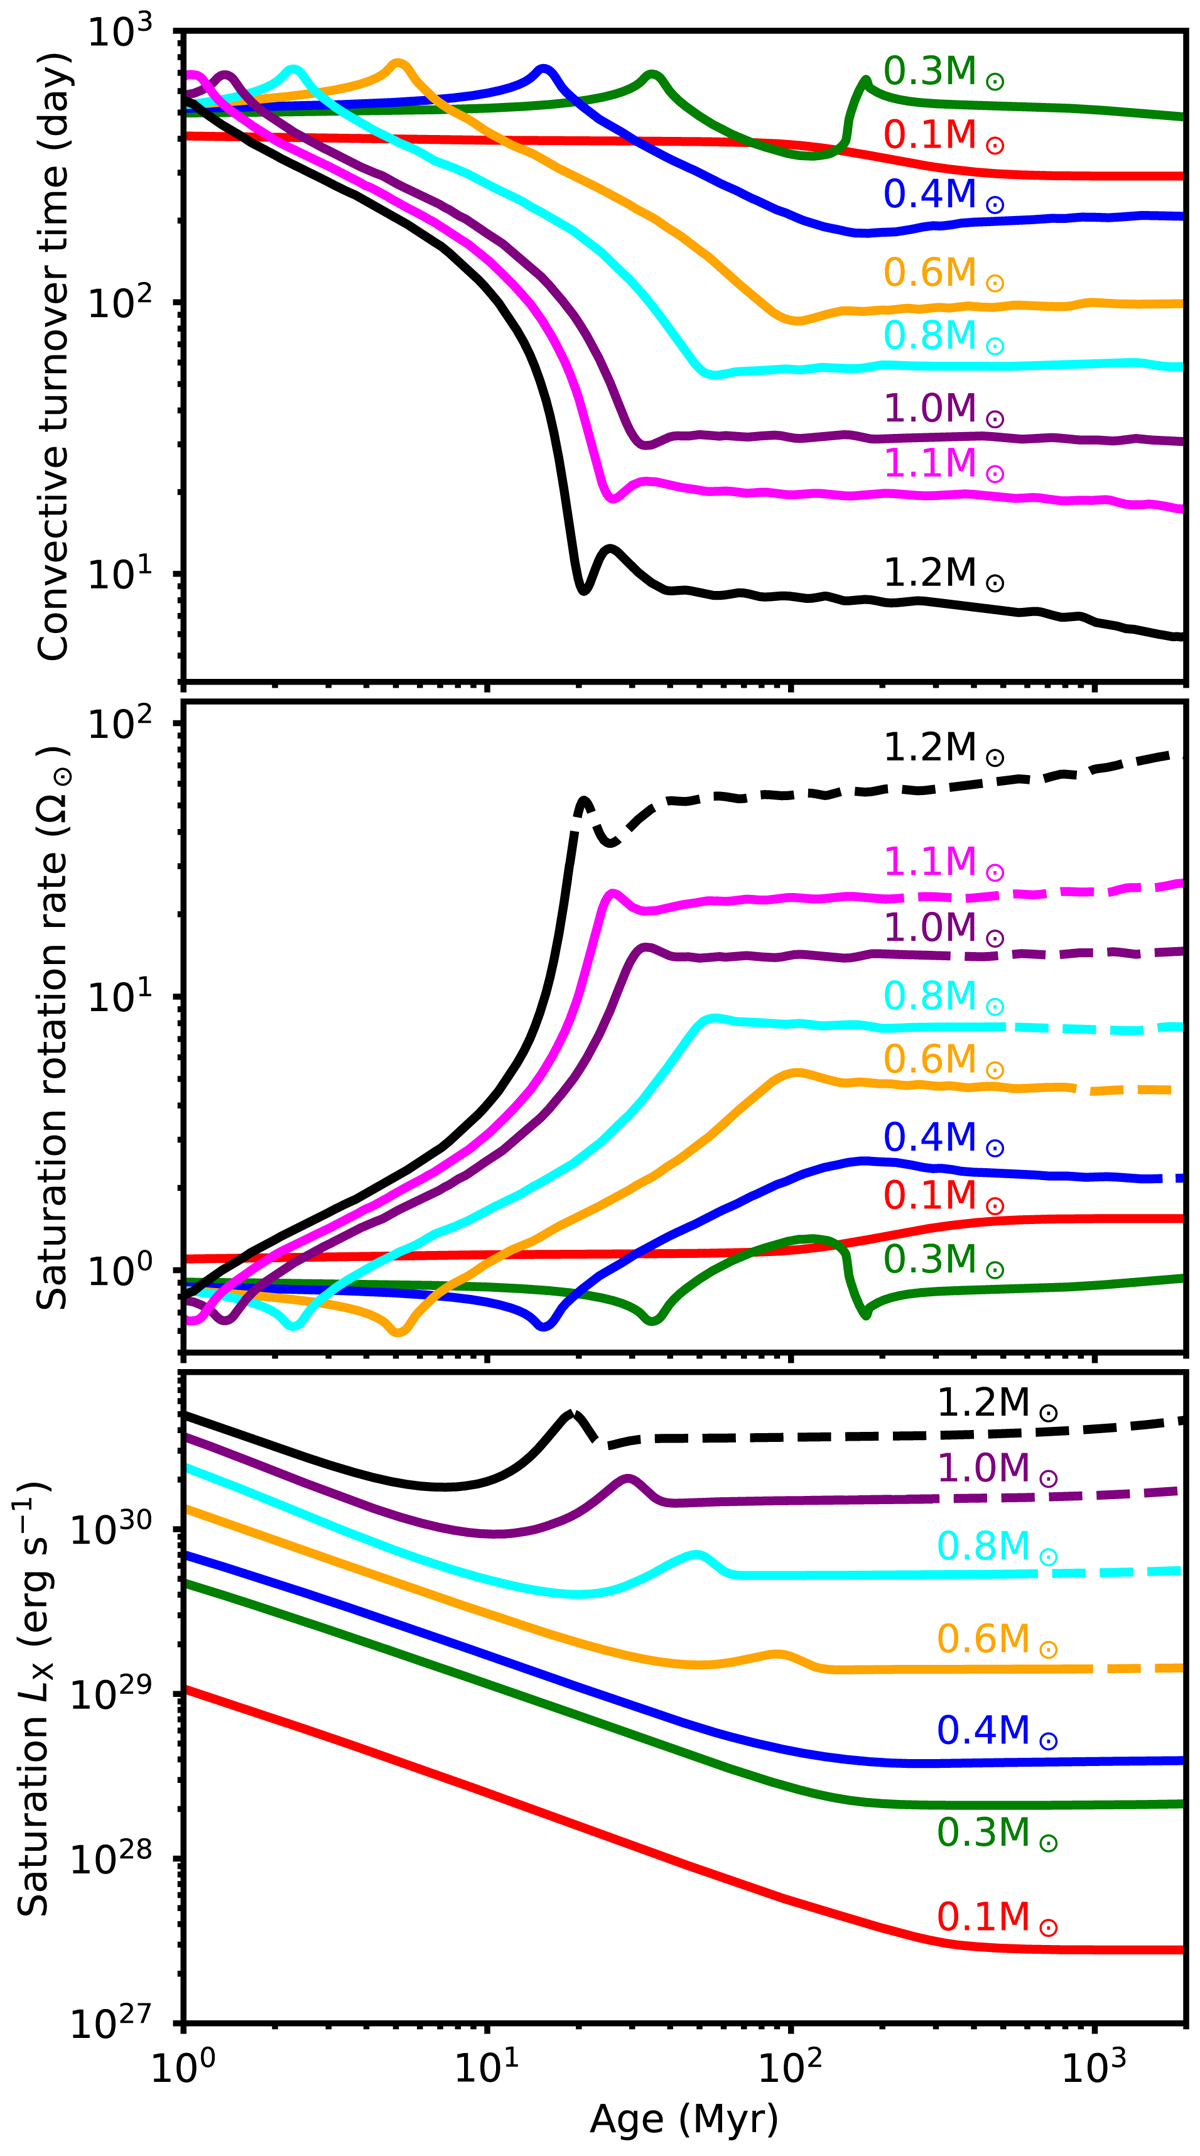
Convective turnover time (upper panel), the rotation rate of the saturation threshold (middle panel), and the X-ray luminosity at the saturation threshold (lower panel) as functions of age for different stellar masses. In the middle and lower panels, the transition from solid to dashed lines shows the time in the evolution for each mass when 90% of all stars have dropped below the saturation threshold. The convective turnover times are from Spada et al. (2013) and the saturation threshold is calculated assuming a saturation Rossby number of 0.0605.
Current usage metrics show cumulative count of Article Views (full-text article views including HTML views, PDF and ePub downloads, according to the available data) and Abstracts Views on Vision4Press platform.
Data correspond to usage on the plateform after 2015. The current usage metrics is available 48-96 hours after online publication and is updated daily on week days.
Initial download of the metrics may take a while.