Fig. 20.
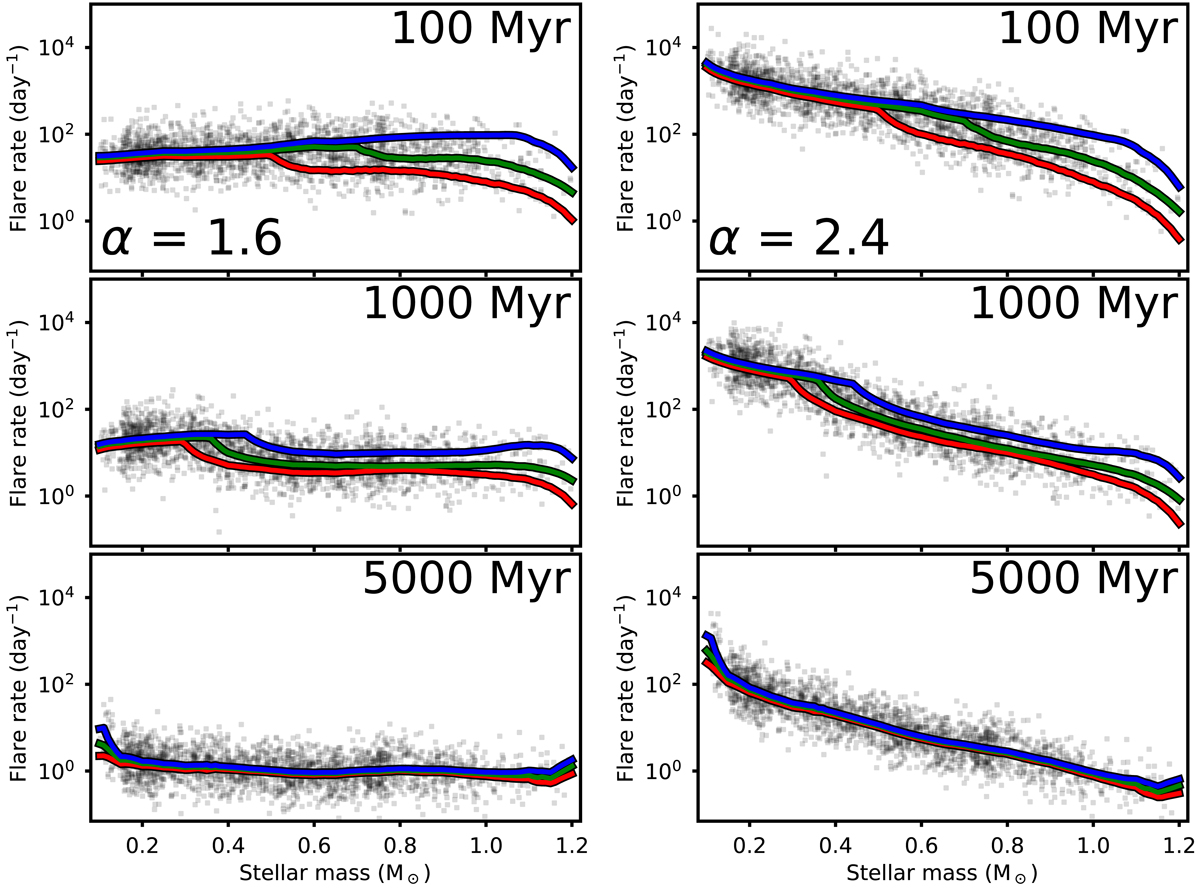
Evolution of the rate of flares with total emitted X-ray and EUV fluences in the habitable zone above 1.8 × 10⁴ erg cm−2 for different stellar masses. The left and right columns show results for α (Eq. (26)) of 1.6 and 2.4, respectively, showing that our uncertainties in the flare energy distribution can significantly influence our understanding of the effects of flares on habitable zone planets. Red, green and blue lines refer to fast, medium, and slow rotators and grey circles show our model distribution.
Current usage metrics show cumulative count of Article Views (full-text article views including HTML views, PDF and ePub downloads, according to the available data) and Abstracts Views on Vision4Press platform.
Data correspond to usage on the plateform after 2015. The current usage metrics is available 48-96 hours after online publication and is updated daily on week days.
Initial download of the metrics may take a while.