Fig. 2.
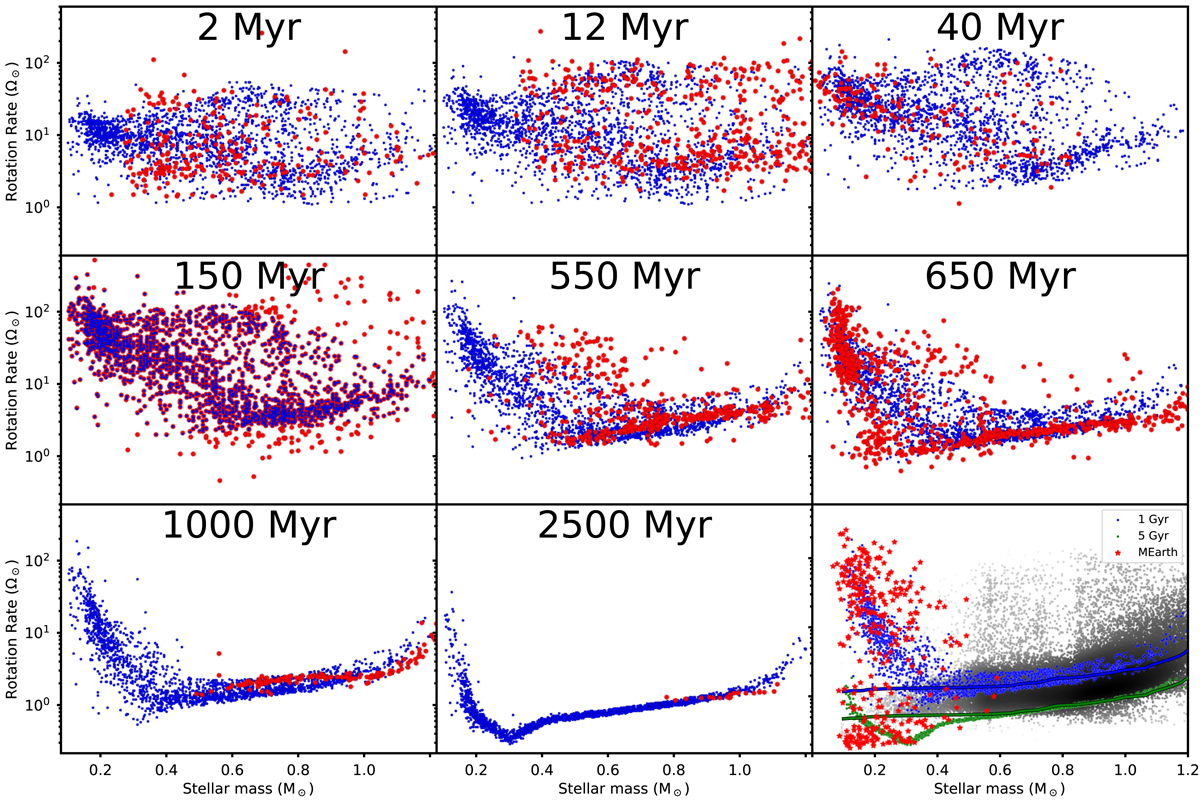
Stellar rotation distribution at each observed age bin listed in Table 1. Red and blue circles show observed and modelled distributions, with the modelled distributions calculated by evolving the observed 150 Myr distribution between 1 and 5000 Myr. In the 150 Myr panel, red circles show stars that we are unable to fit with our rotation model using realistic initial rotation rates. In the lower right panel, black show the distribution measured by Kepler (McQuillan et al. 2014; Santos et al. 2019), red stars show the distribution determined by the MEarth Project (Newton et al. 2016), blue and green circles show the 1 and 5 Gyr modelled distributions, and solid lines show predictions from the gyrochrological relation of Mamajek & Hillenbrand (2008).
Current usage metrics show cumulative count of Article Views (full-text article views including HTML views, PDF and ePub downloads, according to the available data) and Abstracts Views on Vision4Press platform.
Data correspond to usage on the plateform after 2015. The current usage metrics is available 48-96 hours after online publication and is updated daily on week days.
Initial download of the metrics may take a while.