Fig. 17.
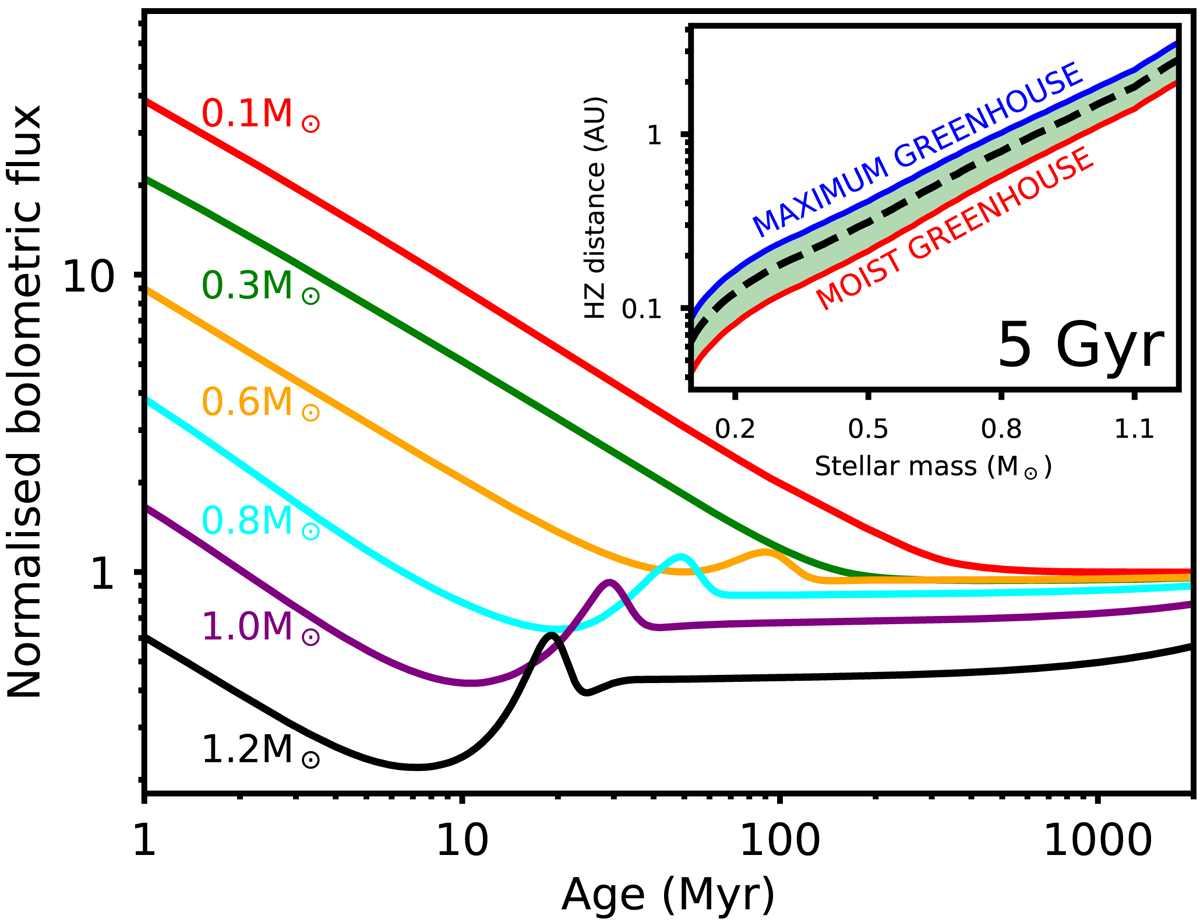
Evolution of stellar bolometric emission as a fraction of the value at 5 Gyr for different stellar masses from the stellar evolution models of Spada et al. (2013). The values on the y-axis can be interpreted both as the normalised bolometric luminosities and as the normalised bolometric fluxes in the habitable zone. The habitable zone orbital distances that we use are based on the 5 Gyr stellar properties and are shown in the inset as the dashed black line.
Current usage metrics show cumulative count of Article Views (full-text article views including HTML views, PDF and ePub downloads, according to the available data) and Abstracts Views on Vision4Press platform.
Data correspond to usage on the plateform after 2015. The current usage metrics is available 48-96 hours after online publication and is updated daily on week days.
Initial download of the metrics may take a while.