Fig. 16.
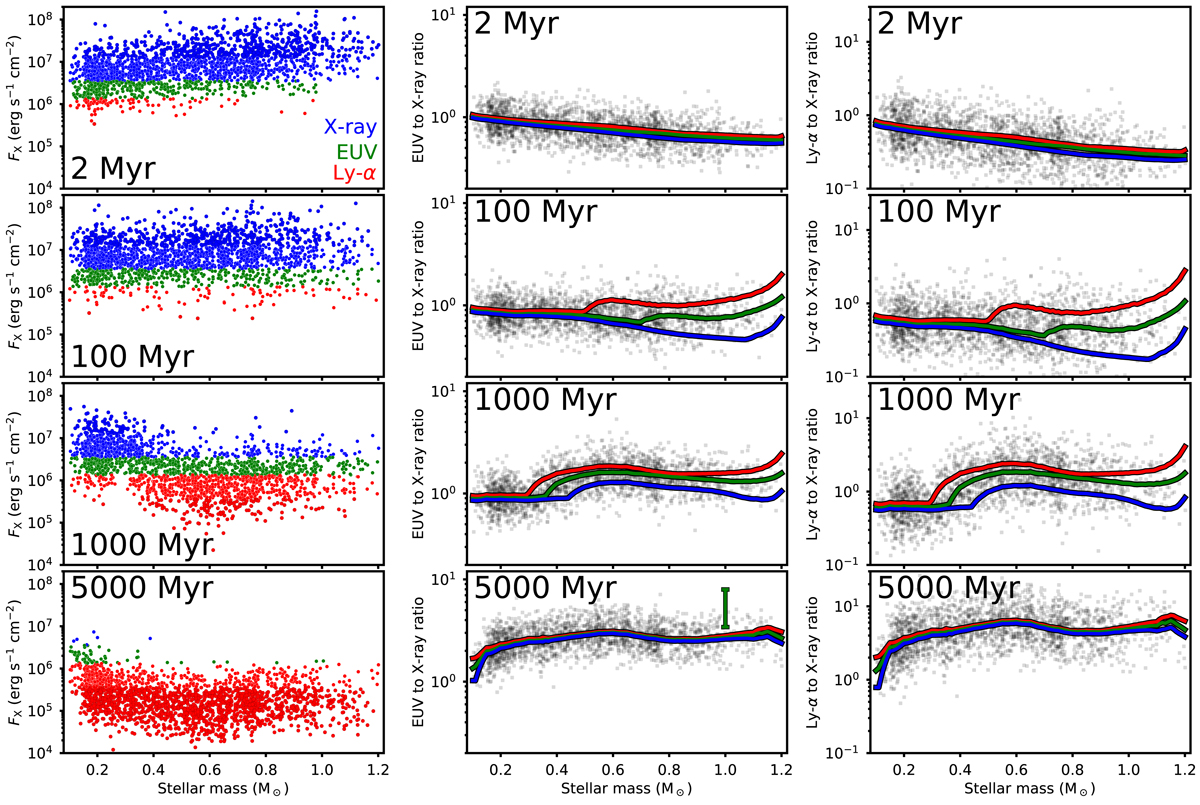
Evolution of X-ray surface flux (left column), the EUV to X-ray ratio (middle column), and the Ly-α to X-ray ratio (right column) as functions of stellar mass. The EUV emission is calculated considering both 10–36 and 36–92 nm. In the left column, circle colours shows which out of X-ray (blue), EUV (green), and Ly-α (red) has the highest luminosity, and circles with dark outlines show that this is more luminous than the other two combined. For example, blue circles with white outlines are used when LX > LEUV and LX > LLyα but LX < LEUV + LLyα, and blue circles with dark outlines are used when LX > LEUV + LLyα. In the middle and right columns, grey circles show our model distribution and blue, green, and red lines show our slow, medium, and fast rotator tracks. The vertical green line in the lower middle panel shows the range of values for the Sun at activity maximum.
Current usage metrics show cumulative count of Article Views (full-text article views including HTML views, PDF and ePub downloads, according to the available data) and Abstracts Views on Vision4Press platform.
Data correspond to usage on the plateform after 2015. The current usage metrics is available 48-96 hours after online publication and is updated daily on week days.
Initial download of the metrics may take a while.