Fig. 14.
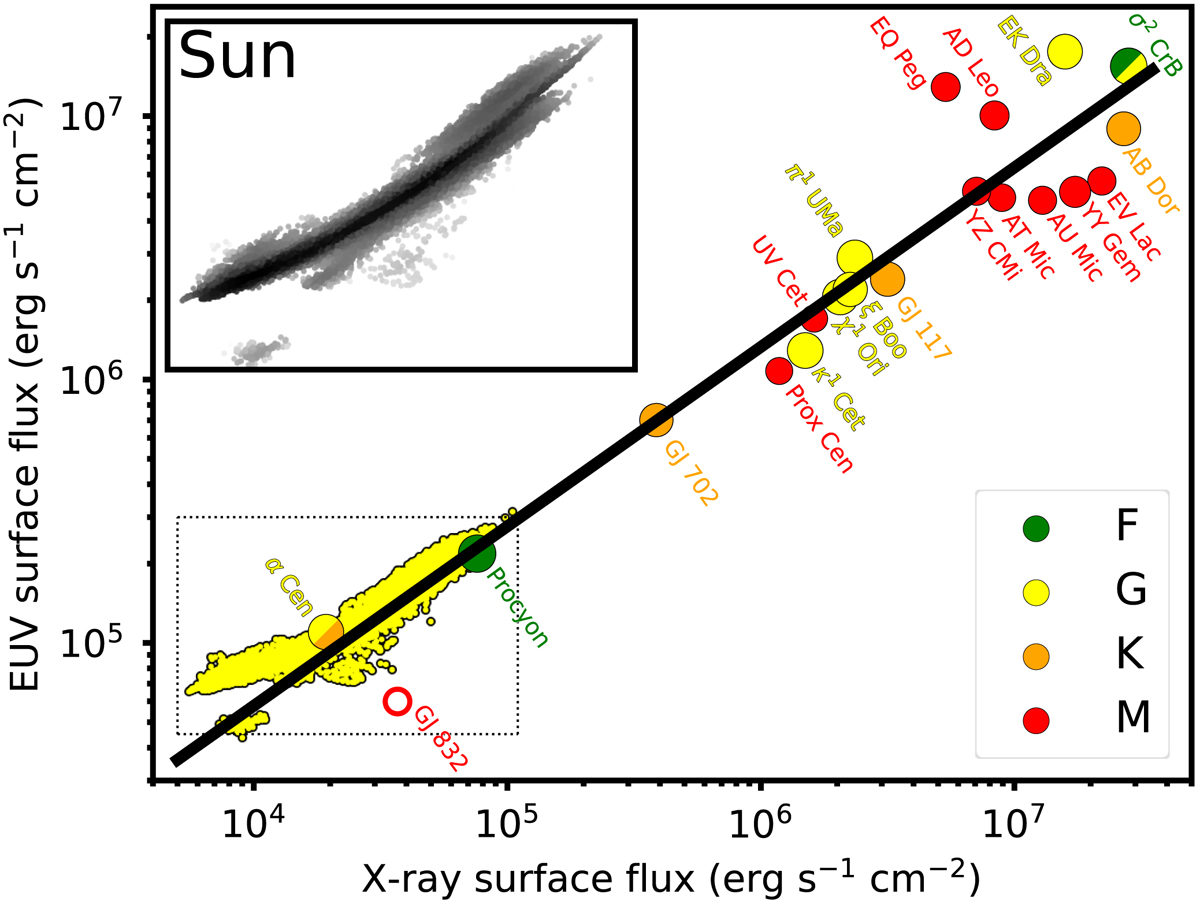
Relation between X-ray (0.517–12.4 nm) and EUV (10–36 nm) surface fluxes, FX and FEUV, for the sample of stars given in Table 3. The colours and sizes of the circles represent spectral type and mass and the yellow region and the inset shows the Sun at different times during the solar cycle. The open red circle shows the M dwarf GJ 832, with fluxes derived from the stellar parameters and semi-empirical model spectrum of Fontenla et al. (2016).
Current usage metrics show cumulative count of Article Views (full-text article views including HTML views, PDF and ePub downloads, according to the available data) and Abstracts Views on Vision4Press platform.
Data correspond to usage on the plateform after 2015. The current usage metrics is available 48-96 hours after online publication and is updated daily on week days.
Initial download of the metrics may take a while.