Fig. 12.
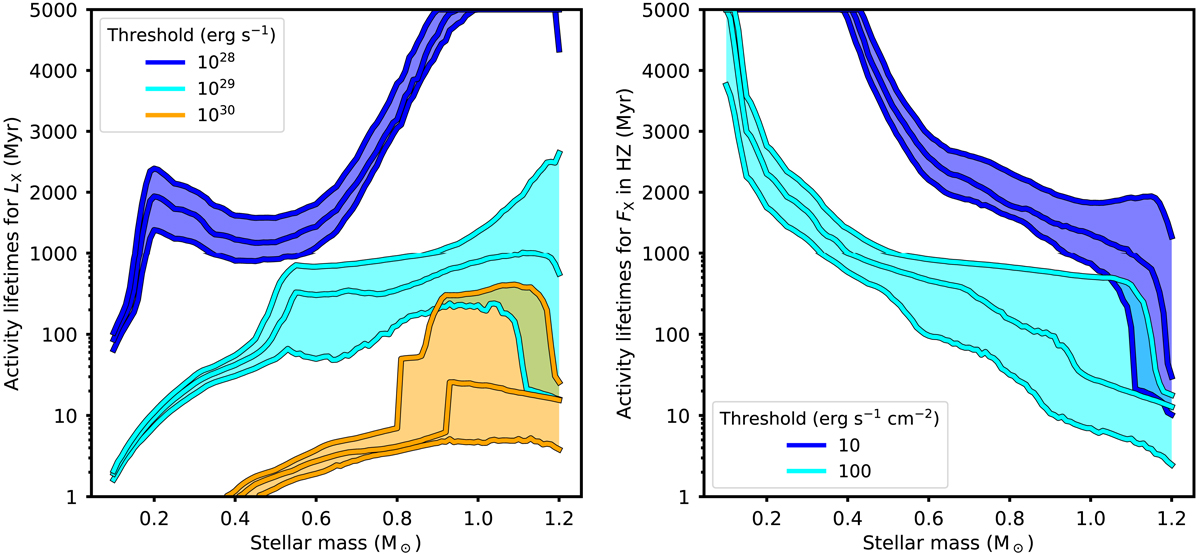
Ages of stars when they fall below threshold values for their X-ray luminosity (left panel) and X-ray flux in the habitable zone (right panel) as functions of stellar mass. In both panels, each colour represents a specific choice for the threshold value and the lines from bottom to top for each colour shows the values for slow, medium, and fast rotator cases. In both panels, the y-axes are logarithmic for ages up to 1000 Myr and linear at later ages.
Current usage metrics show cumulative count of Article Views (full-text article views including HTML views, PDF and ePub downloads, according to the available data) and Abstracts Views on Vision4Press platform.
Data correspond to usage on the plateform after 2015. The current usage metrics is available 48-96 hours after online publication and is updated daily on week days.
Initial download of the metrics may take a while.