Free Access
Fig. 10.
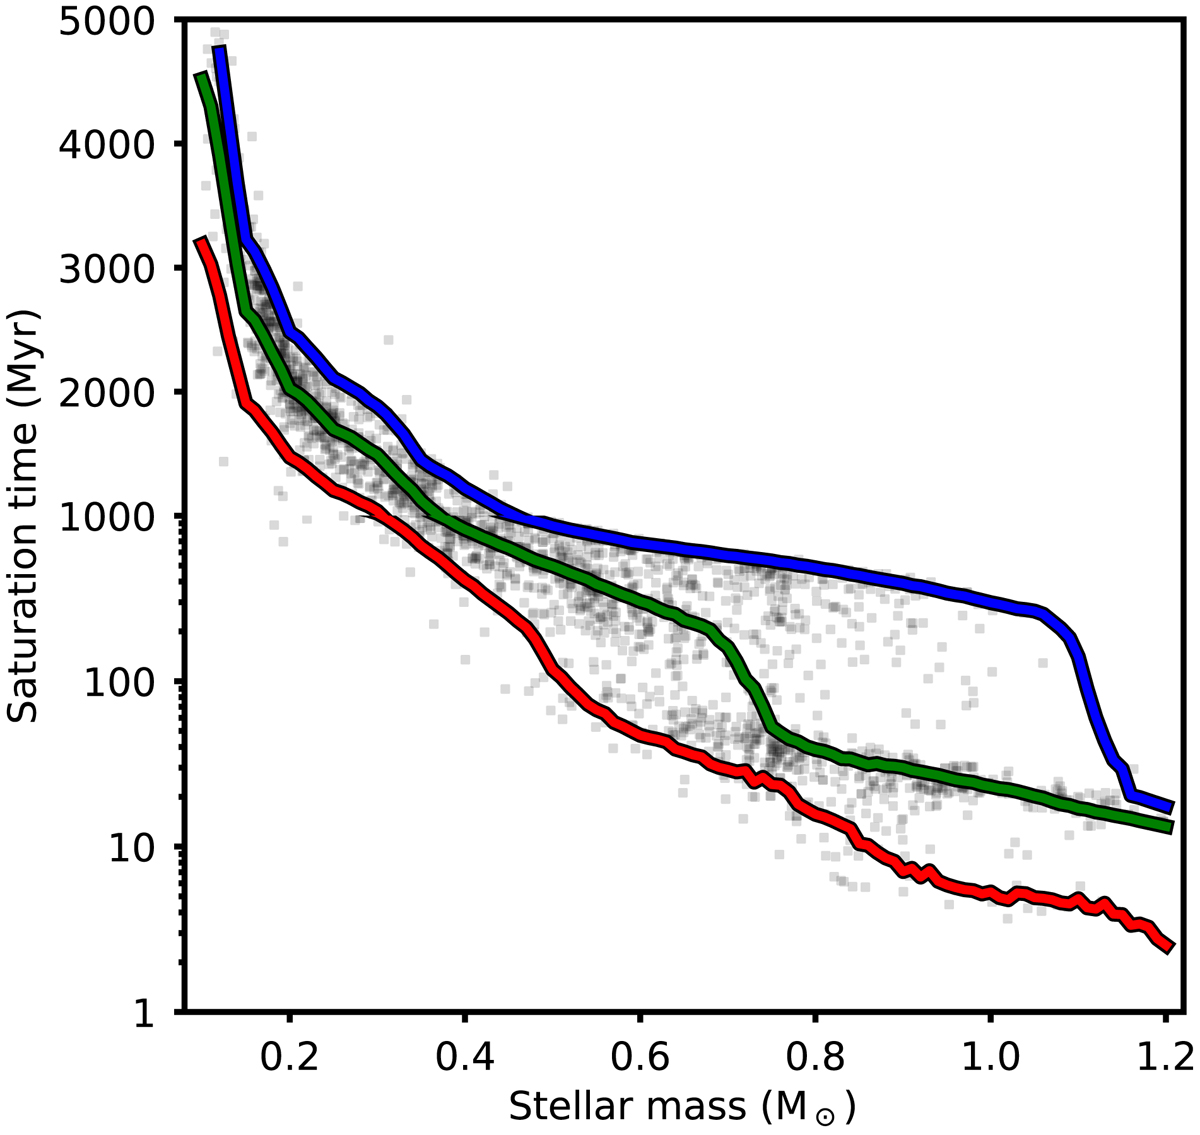
Age at which a star falls below the saturation threshold as a function of stellar mass for slow (red), medium (green), and fast (blue) rotators. The background circles show when each of the stars in our model distribution become unsaturated. The y-axis is logarithmic for ages up to 1000 Myr and linear at later ages.
Current usage metrics show cumulative count of Article Views (full-text article views including HTML views, PDF and ePub downloads, according to the available data) and Abstracts Views on Vision4Press platform.
Data correspond to usage on the plateform after 2015. The current usage metrics is available 48-96 hours after online publication and is updated daily on week days.
Initial download of the metrics may take a while.