Fig. 6
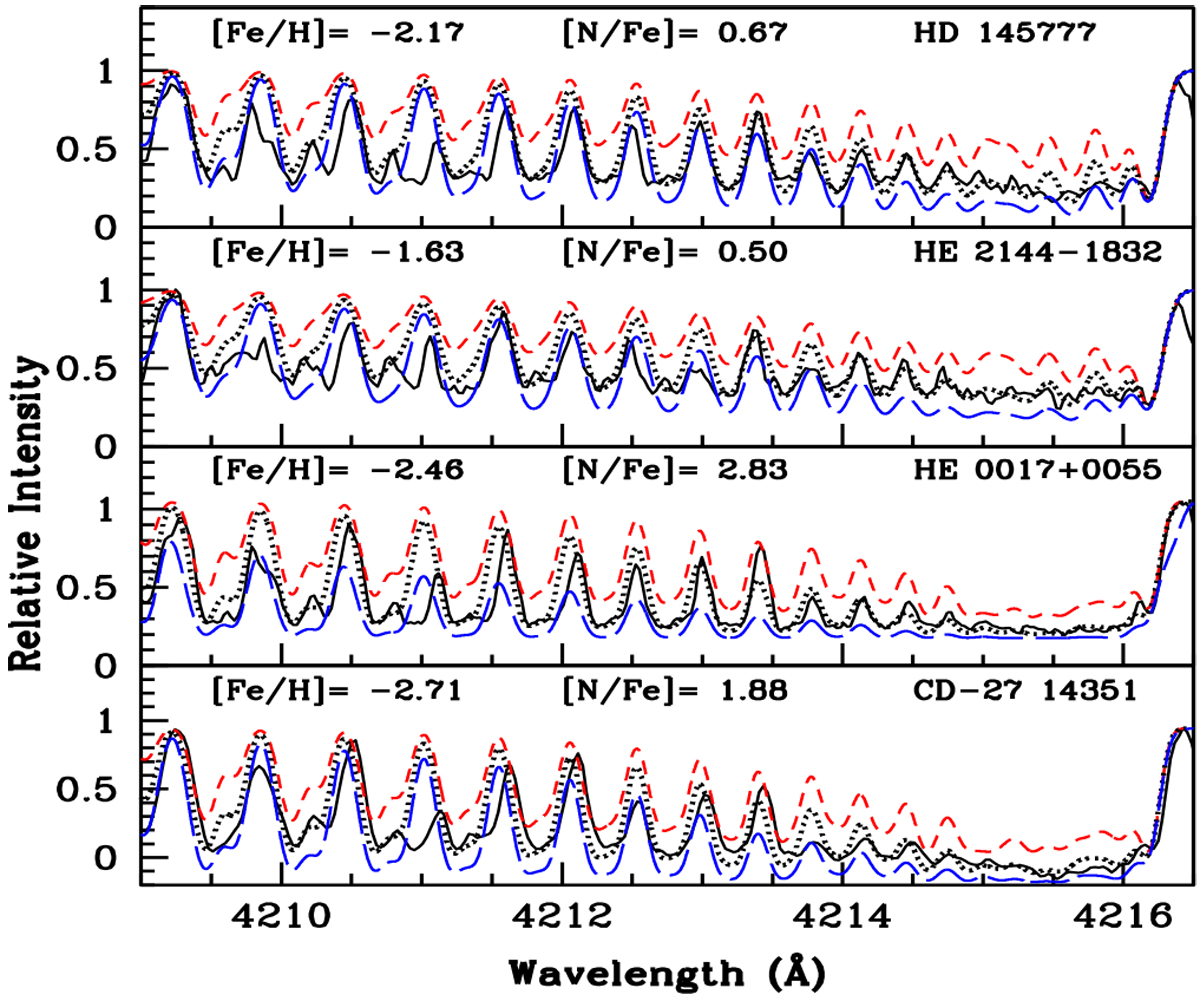
Synthesis of CN band around 4215 Å. The dotted line represents synthesised spectra and the solid line indicates the observed spectra. Two alternative fits, the short-dashed line corresponding to Δ[N/Fe] = −0.3 and the long-dashed line corresponding to Δ[N/Fe] = +0.3 are shown to illustrate the sensitivity of the line strengths to N abundance.
Current usage metrics show cumulative count of Article Views (full-text article views including HTML views, PDF and ePub downloads, according to the available data) and Abstracts Views on Vision4Press platform.
Data correspond to usage on the plateform after 2015. The current usage metrics is available 48-96 hours after online publication and is updated daily on week days.
Initial download of the metrics may take a while.