Fig. A.1
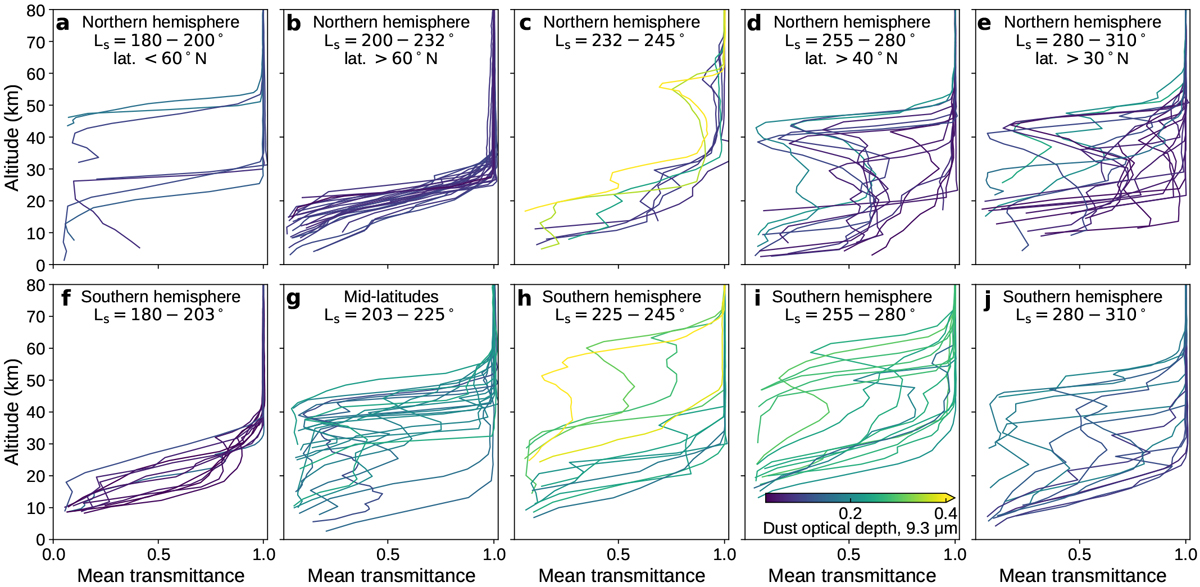
Time evolution of vertical profiles of the transmission level of solar occultation absorption spectra recorded with ACS MIR. Panels a–d: five time periods in the northern hemisphere that coincide with observed changes in dust activity and the detection of HCl. Panels e–h: same for the southern hemisphere. Lines are coloured by the dust optical depth at 9.3 μm derived from Mars Climate Sounder observations (Montabone et al. 2020).
Current usage metrics show cumulative count of Article Views (full-text article views including HTML views, PDF and ePub downloads, according to the available data) and Abstracts Views on Vision4Press platform.
Data correspond to usage on the plateform after 2015. The current usage metrics is available 48-96 hours after online publication and is updated daily on week days.
Initial download of the metrics may take a while.