Fig. 5
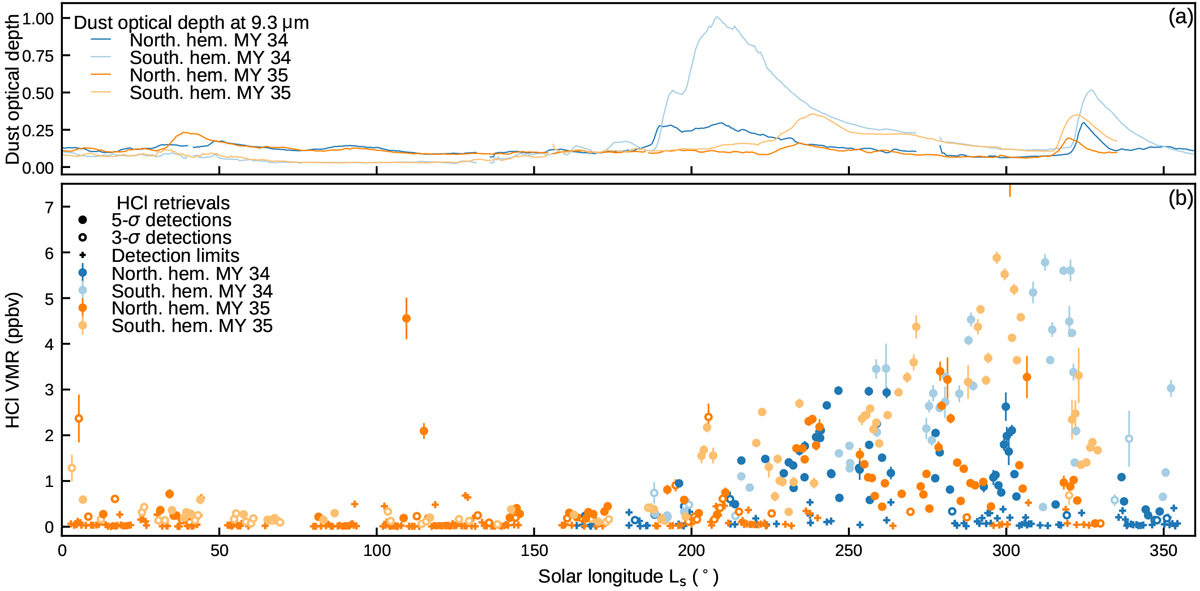
Time evolution of HCl detections and the meridional column dust opacities for Mars years 34 (blue) and 35 (orange). Panel a: dust optical depth at 9.3 μm derived fromMars Climate Sounder (Montabone et al. 2020). The mean column dust opacities are first zonally averaged, then a meridional average is shown. The meridional averages are taken over bands covering the northern hemisphere (40–70°N) and southern hemisphere (40–70°S). Panel b: maxima of ACS MIR HCl detections below 30 km (circles). For observations in which no HCl was detected at a 5σ level, a 3σ criterion is first used (open circles), and if this is not met, detection limits are given (crosses).
Current usage metrics show cumulative count of Article Views (full-text article views including HTML views, PDF and ePub downloads, according to the available data) and Abstracts Views on Vision4Press platform.
Data correspond to usage on the plateform after 2015. The current usage metrics is available 48-96 hours after online publication and is updated daily on week days.
Initial download of the metrics may take a while.