Fig. 4
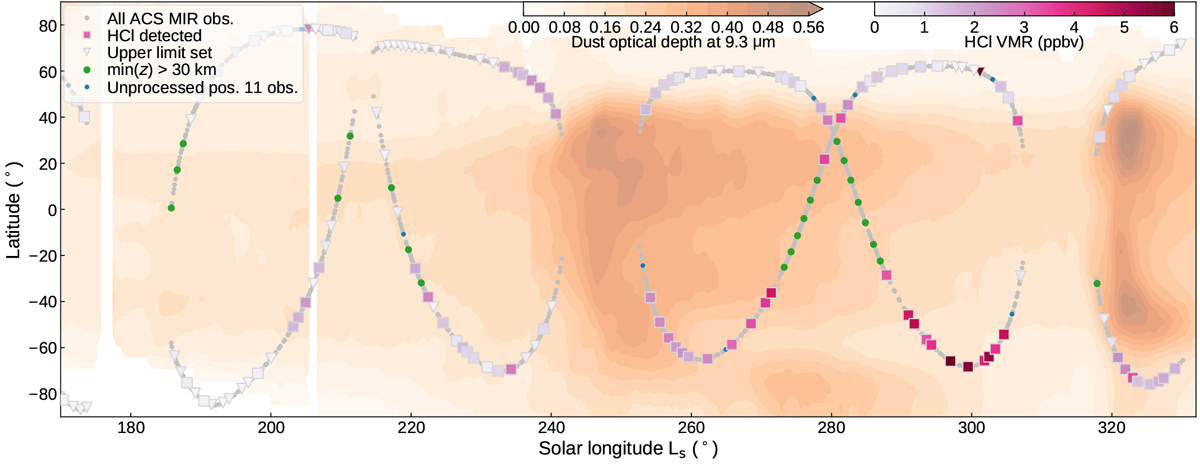
Distribution of dust and ACS MIR occultation tangent points during the Mars year 35 dust season. The background, in orange, shows the derived climatology of dust for MY 35 as observed by the Mars Climate Sounder (Montabone et al. 2020) (zonal means at each time step). Over this is plottedthe latitude of ACS MIR occultations made in MY 35 as a function of solar longitude (Ls) for the period Ls = 160–300°. All ACS MIR occultations are grey, and those made using position 11 in which HCl was detected are squares coloured according to the maximum HCl VMR observed below 30 km. Observations where only an upper limit of HCl could be obtained are shown as triangles, and those where the atmosphere below 30 km is obscured by aerosols are indicated in green, and occultation not yet processed are blue.
Current usage metrics show cumulative count of Article Views (full-text article views including HTML views, PDF and ePub downloads, according to the available data) and Abstracts Views on Vision4Press platform.
Data correspond to usage on the plateform after 2015. The current usage metrics is available 48-96 hours after online publication and is updated daily on week days.
Initial download of the metrics may take a while.