Fig. 2
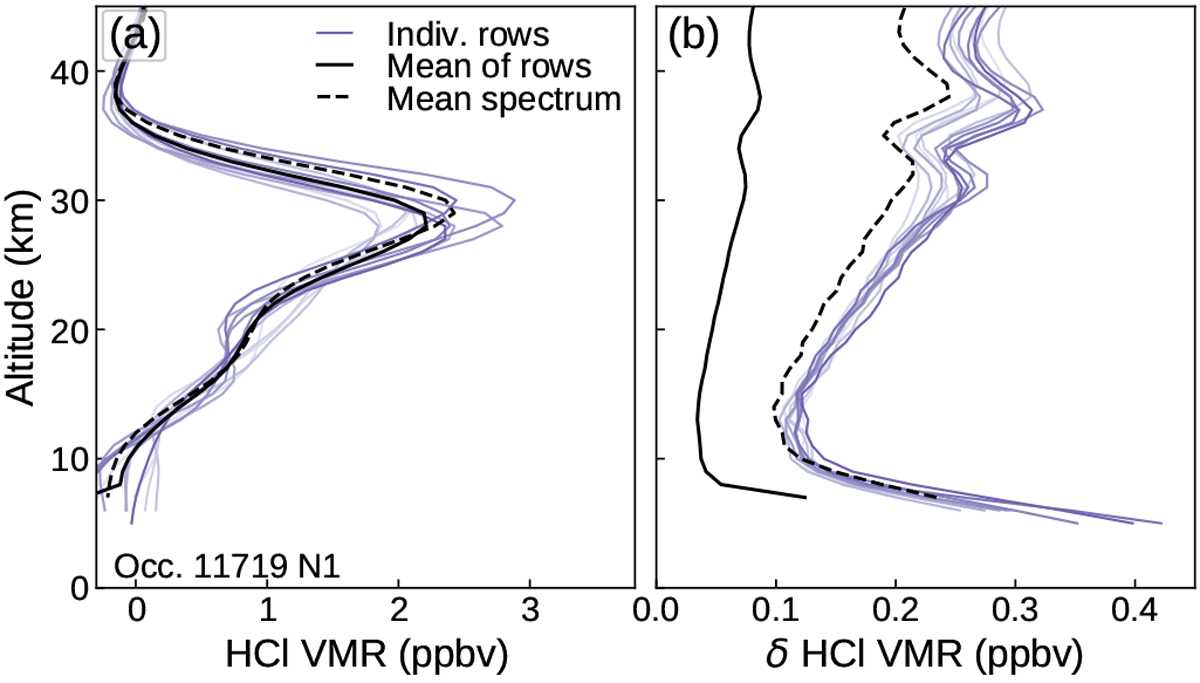
Example retrieved vertical profile of HCl during the Mars year 35 dust season. Panel a: ensemble of retrieved vertical profiles (shades of purple, as in Fig. 1) made for one occultation. Each line corresponds to a set of detector rows from which spectra were extracted. Panel b: corresponding ensemble of uncertainties. Panels a and b: the solid black lines show the weighted mean of the ensemble of retrievals, and the uncertainty (standard error). The dashed black lines are for a retrieval made using the mean spectra shown in Fig. 1.
Current usage metrics show cumulative count of Article Views (full-text article views including HTML views, PDF and ePub downloads, according to the available data) and Abstracts Views on Vision4Press platform.
Data correspond to usage on the plateform after 2015. The current usage metrics is available 48-96 hours after online publication and is updated daily on week days.
Initial download of the metrics may take a while.