Fig. 1
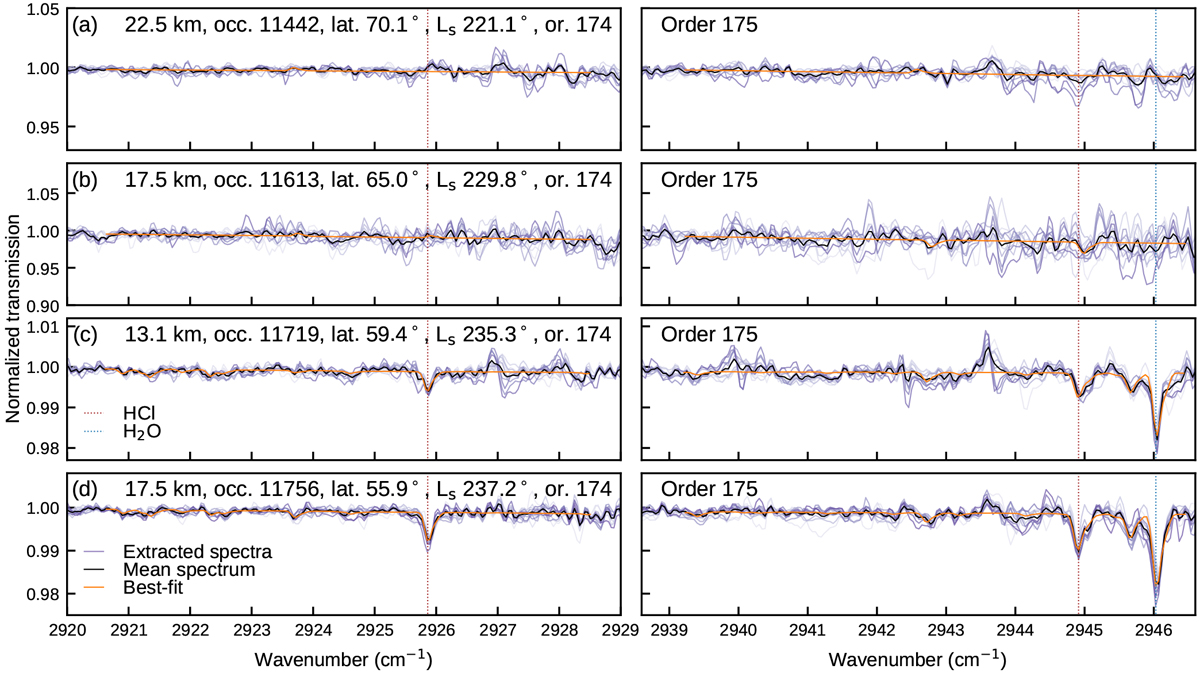
Measured spectra from diffraction orders 174 and 175 for four occultations recorded between Ls 220 and 240° at high northern latitudes. Shown are the individual spectra extracted from a dozen detector rows covering the same diffraction orders (shades of purple). Also shown are the mean spectra with reduced noise, and best-fit lines for the mean spectra. Positions of major HCl and H2 O lines are indicated with dashed vertical lines in orange and blue, respectively. The first two occultations, panels a and b, do not feature a detectable quantity of HCl or water vapour, while the later occultations, panels c and d, feature 0.5 and 0.9 ppbv HCl and around 60 and 120 ppmv H2 O, respectively.
Current usage metrics show cumulative count of Article Views (full-text article views including HTML views, PDF and ePub downloads, according to the available data) and Abstracts Views on Vision4Press platform.
Data correspond to usage on the plateform after 2015. The current usage metrics is available 48-96 hours after online publication and is updated daily on week days.
Initial download of the metrics may take a while.