Fig. 2
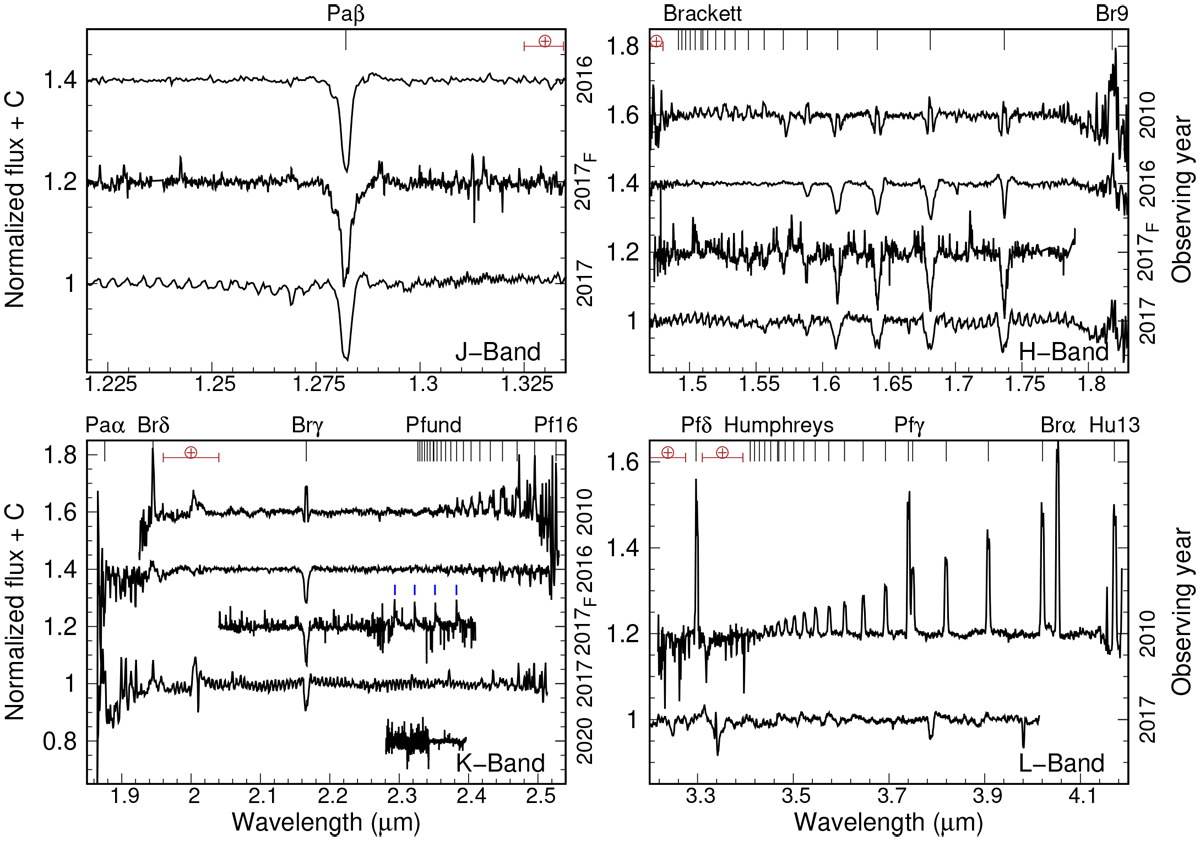
NIR spectra of 12 Vul in the J- (upper-left panel), H- (upper-right panel), K- (lower-left panel), and L-bands (lower-right panel). All the spectra were taken with GNIRS, except the one obtained with FIRE, which is pointed to with an F in the observing year. Spectra were normalized and vertically shifted for a better visualization. Positions of the hydrogen lines are marked in the top of each panel, and spectral ranges with telluric remnants are pointed out with the symbol ⊕. The 12CO band heads in emission in the K-band are indicated with blue tics.
Current usage metrics show cumulative count of Article Views (full-text article views including HTML views, PDF and ePub downloads, according to the available data) and Abstracts Views on Vision4Press platform.
Data correspond to usage on the plateform after 2015. The current usage metrics is available 48-96 hours after online publication and is updated daily on week days.
Initial download of the metrics may take a while.