Fig. 9.
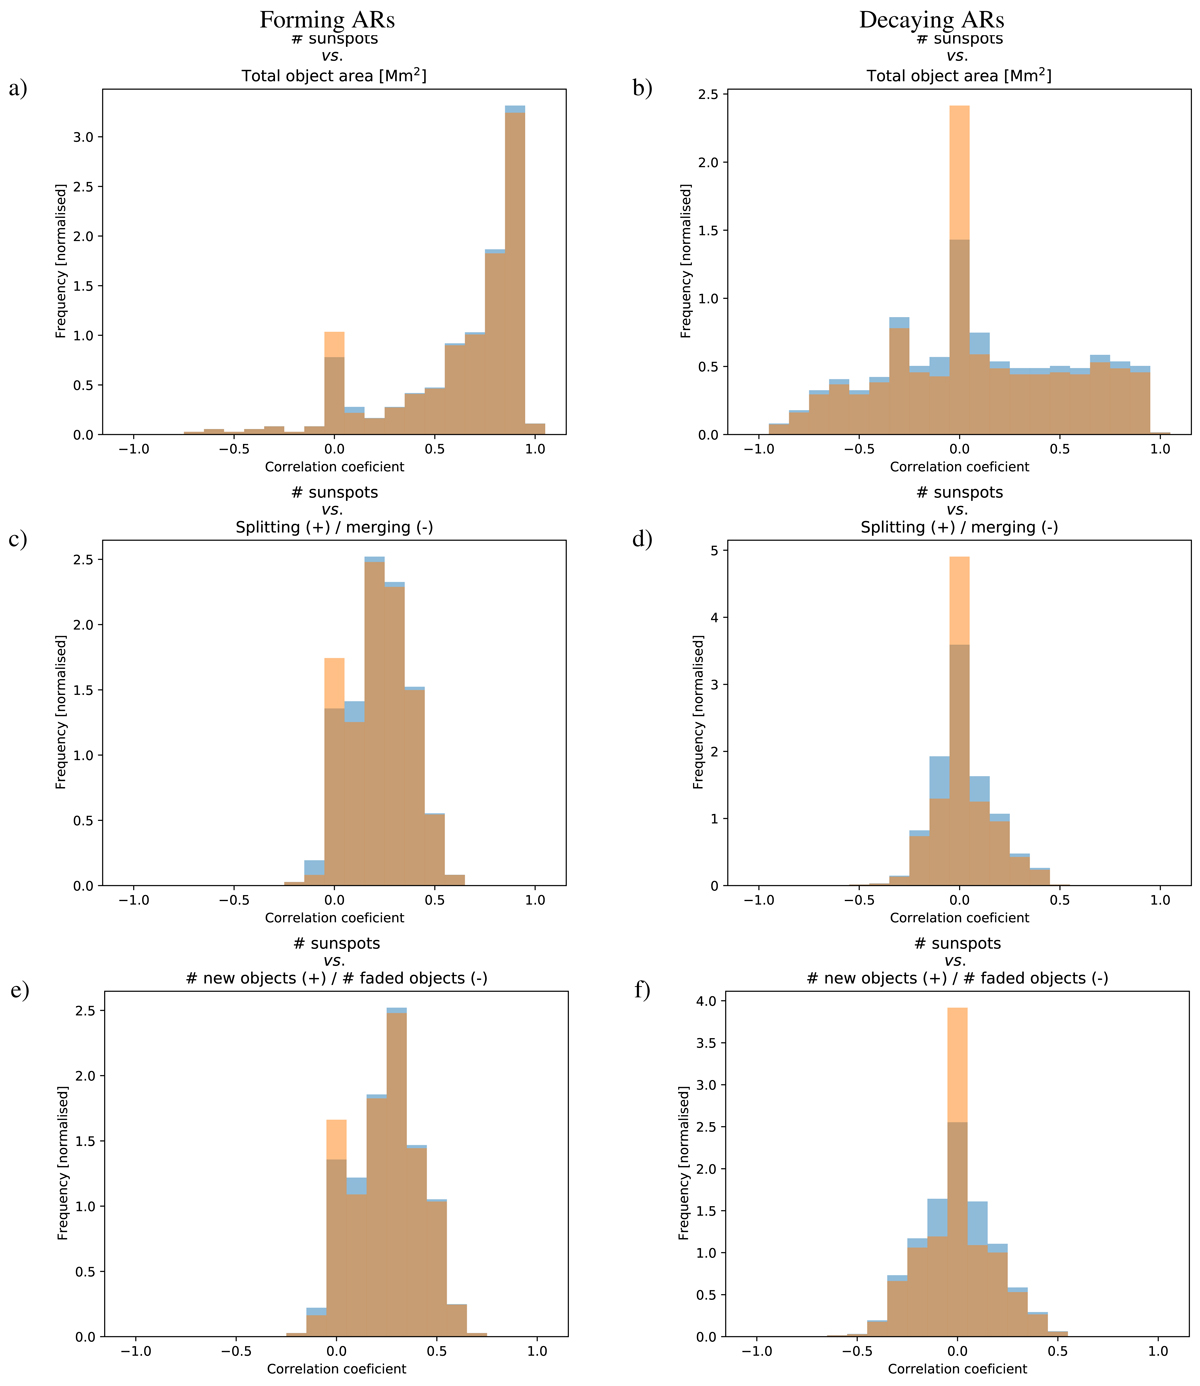
Histograms of correlation coefficients between various quantities describing the evolution of the fragments in the forming (left) and decaying (right) active regions. The blue bars represent the histograms of all correlation coefficients, whereas the orange-bar histograms were derived using only the statistically significant correlations coefficients. The brown colour indicates the overlap of both types of histograms.
Current usage metrics show cumulative count of Article Views (full-text article views including HTML views, PDF and ePub downloads, according to the available data) and Abstracts Views on Vision4Press platform.
Data correspond to usage on the plateform after 2015. The current usage metrics is available 48-96 hours after online publication and is updated daily on week days.
Initial download of the metrics may take a while.