Free Access
Fig. 6.
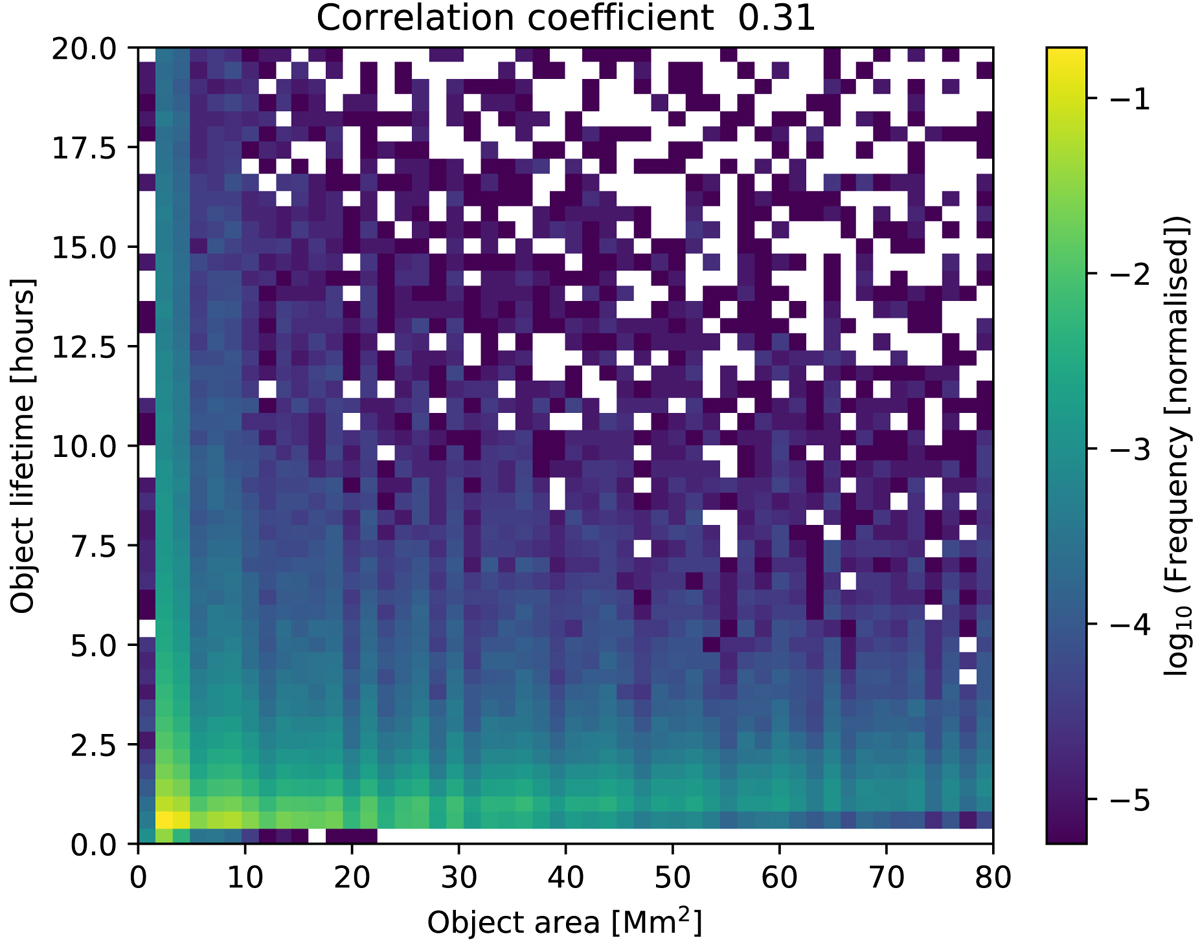
2D histogram of object area and lifetime. The histogram is plotted in the logarithmic scale. It indicates that there is no significant correlation between the size and the lifetime of the objects.
Current usage metrics show cumulative count of Article Views (full-text article views including HTML views, PDF and ePub downloads, according to the available data) and Abstracts Views on Vision4Press platform.
Data correspond to usage on the plateform after 2015. The current usage metrics is available 48-96 hours after online publication and is updated daily on week days.
Initial download of the metrics may take a while.