Fig. 4.
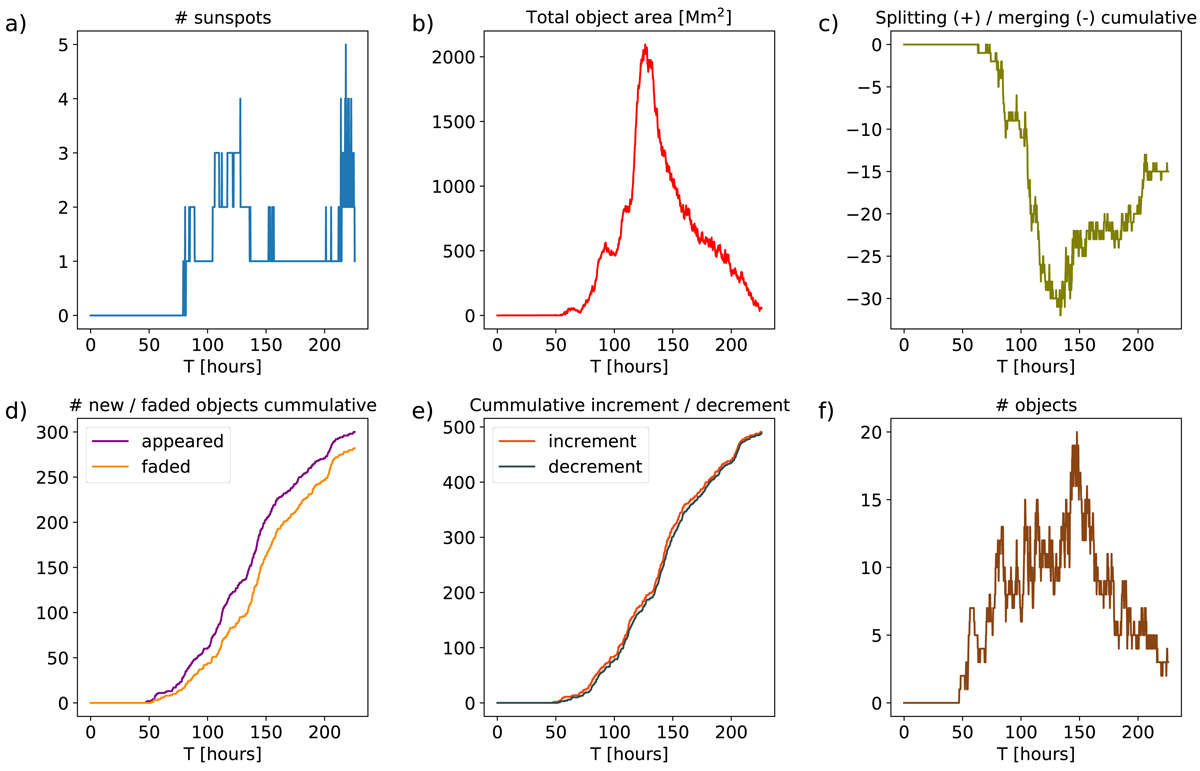
Time evolution of various quantities describing the sunspots and fragments in NOAA 11076. One can see the evolution of the number of detected sunspots (a) and their area (b). The cumulative curve of the splitting or merging events is also plotted (c), showing which of the quantities prevailed until the given moment. Panel d: one can see the cumulative curves of the number of objects that newly appeared and that faded staying alone. Panel e: one can see the cumulative balance between the increase and decrease in the number of objects. Finally, in (panel f), the total number of the detected objects at the given time is plotted.
Current usage metrics show cumulative count of Article Views (full-text article views including HTML views, PDF and ePub downloads, according to the available data) and Abstracts Views on Vision4Press platform.
Data correspond to usage on the plateform after 2015. The current usage metrics is available 48-96 hours after online publication and is updated daily on week days.
Initial download of the metrics may take a while.