Free Access
Fig. 3.
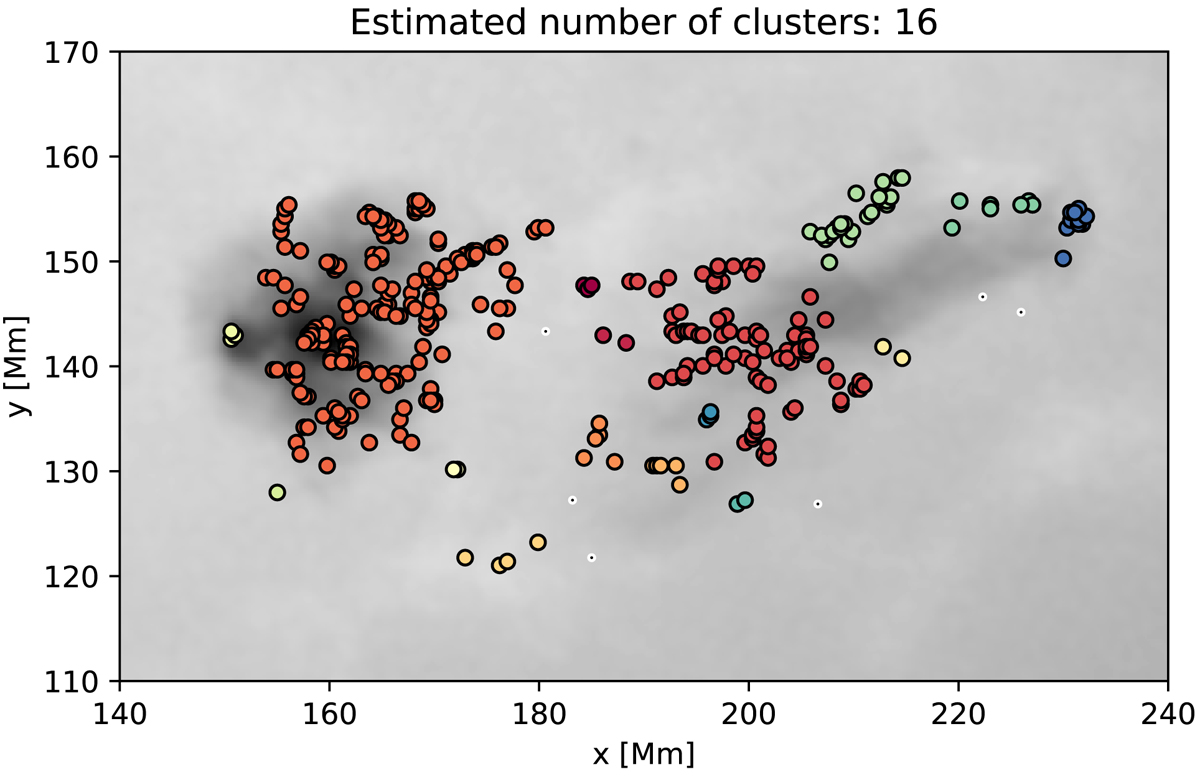
Clustering of merging and splitting events over the portion of the field of view of NOAA 11076. Different colours indicate detected clusters. Black points with white strokes represent points which do not belong to any of detected clusters.
Current usage metrics show cumulative count of Article Views (full-text article views including HTML views, PDF and ePub downloads, according to the available data) and Abstracts Views on Vision4Press platform.
Data correspond to usage on the plateform after 2015. The current usage metrics is available 48-96 hours after online publication and is updated daily on week days.
Initial download of the metrics may take a while.